into embedded
Integrated Visualization for Converging Technologies
Understand

Understanding the architecture of embedded systems is essential for effective troubleshooting and performance optimization. Engineers must grasp the intricate interactions between hardware and software to identify potential issues. This knowledge enables them to detect faults and inefficiencies that may span across both layers. Visualization plays a key role in this process by offering clear, intuitive insights into system behavior. With visual tools, engineers can easily pinpoint problems, monitor real-time performance, and analyze complex data. By enhancing system understanding through visualization, engineers can more quickly resolve issues, optimize performance, and improve overall system efficiency and reliability.
Analyse

Signal calculation tools are vital for improving debugging and system understanding. By combining signals through mathematical operations, they help uncover hidden relationships and errors in the system. These tools can generate reference signals for comparison, implement protocol parsers to decode data exchanges, and extract statistical information for performance analysis. Additionally, they can automatically search for conflicts or inconsistencies in signals, enabling quicker issue detection and resolution. This not only accelerates the debugging process but also provides deeper insights into system behavior, enhancing overall system performance and reliability.
Debug

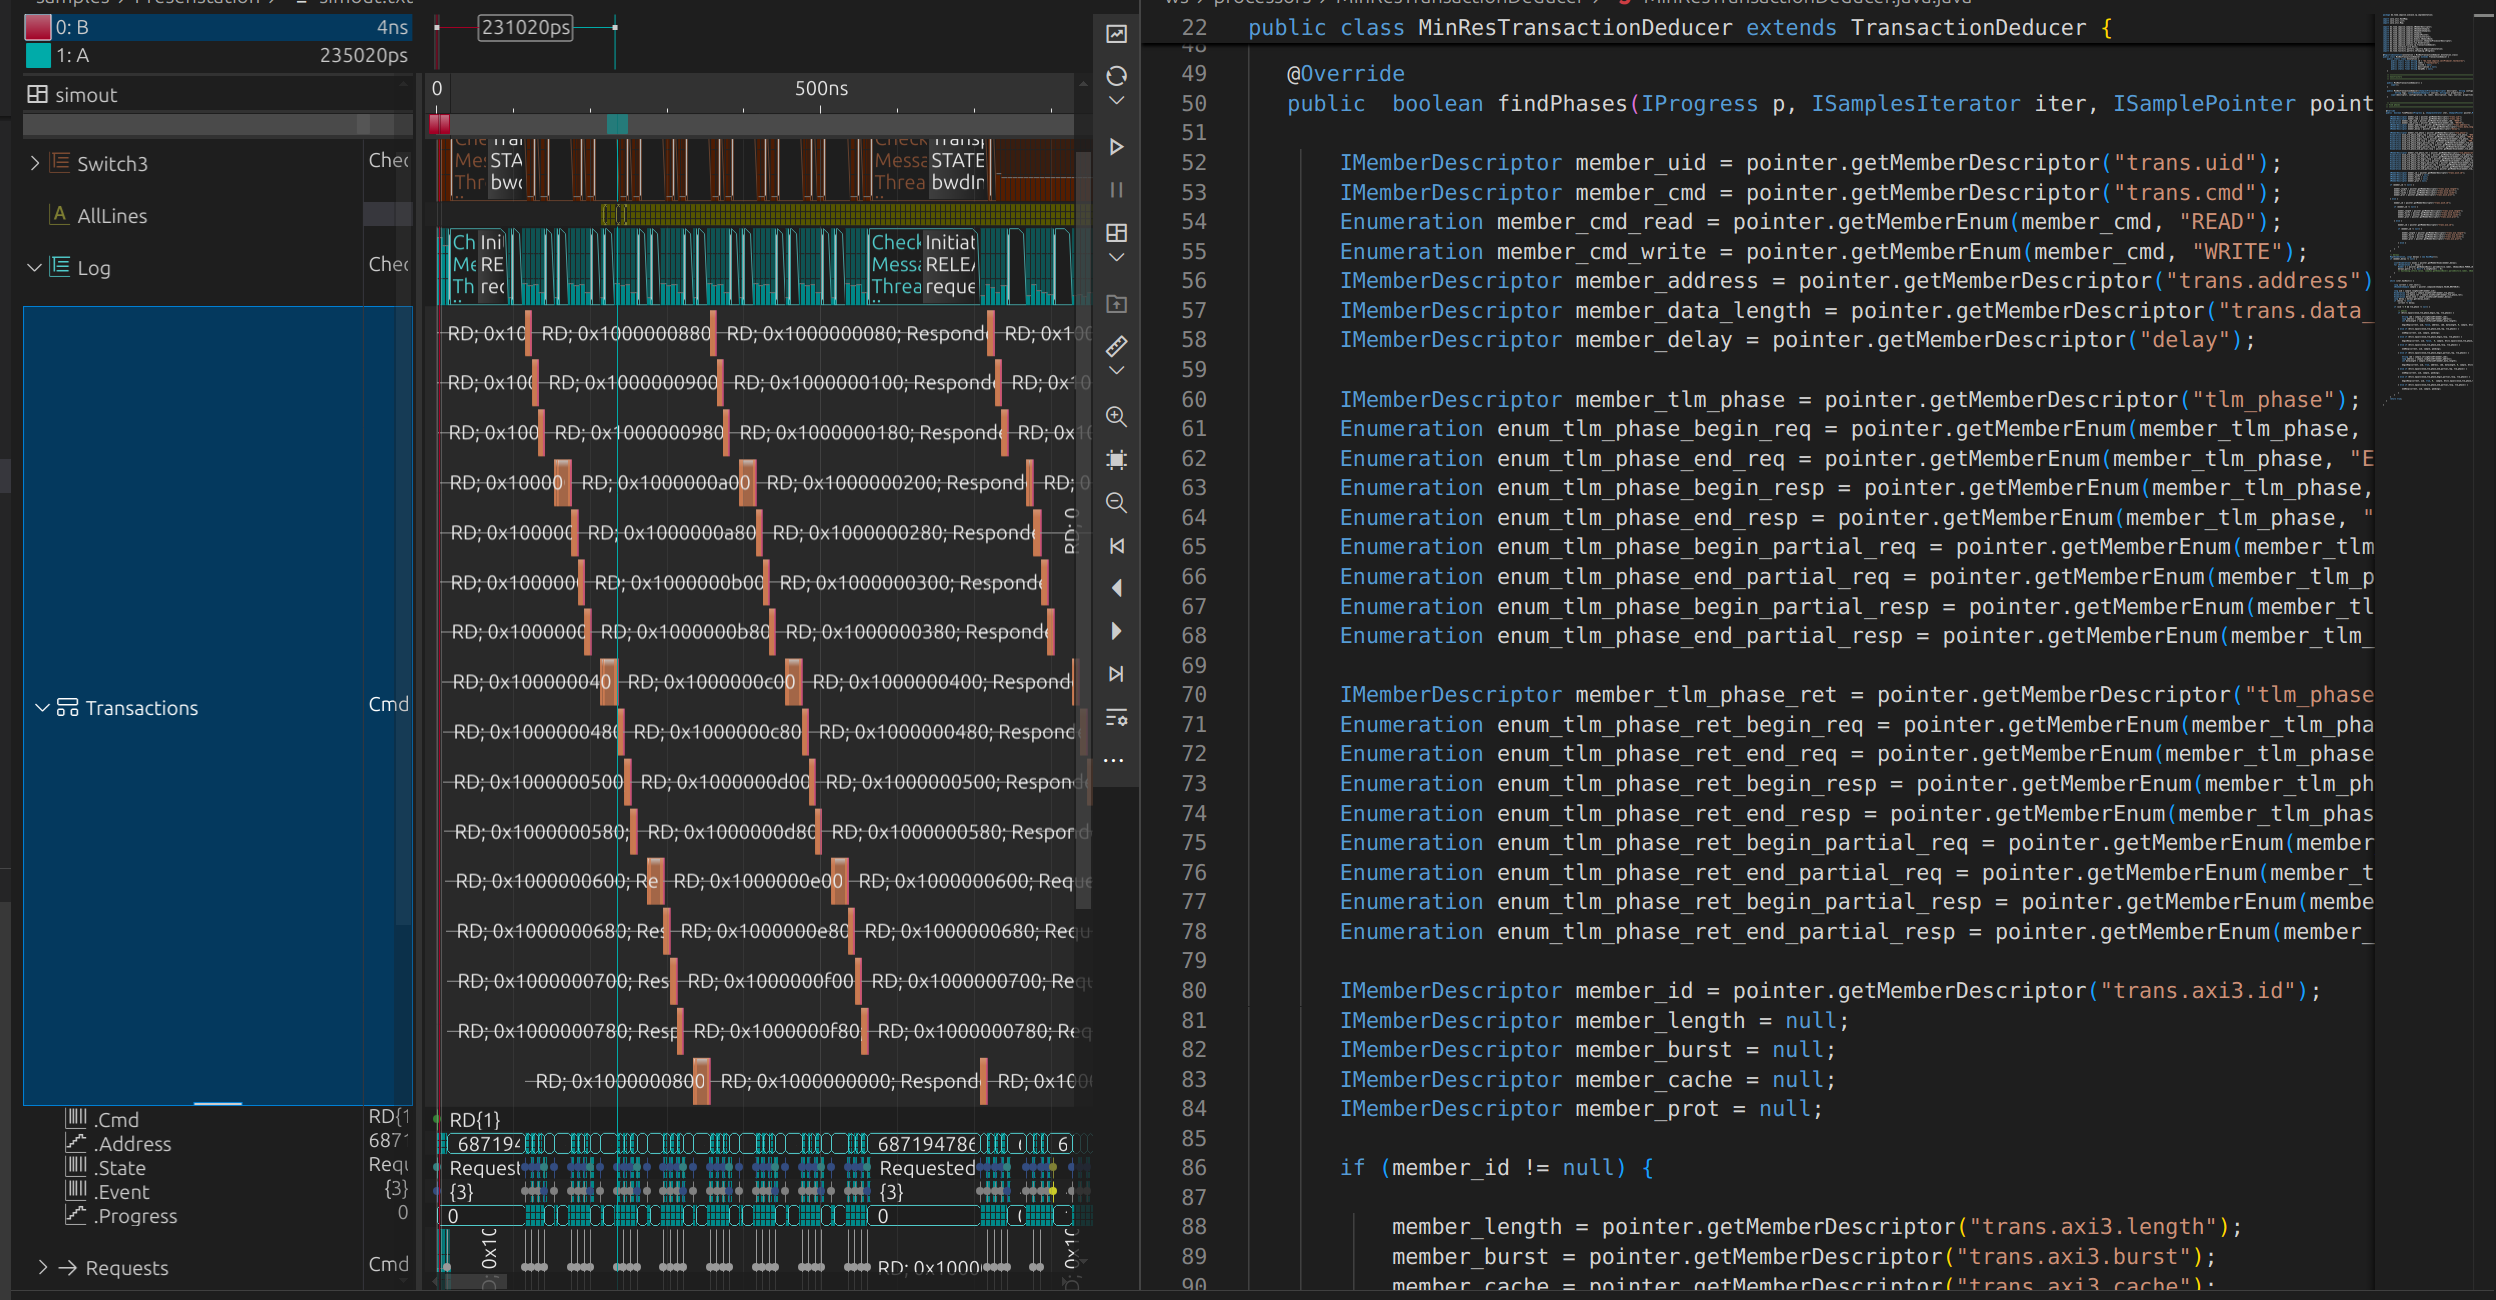
Debugging complex embedded systems requires a deep understanding of both hardware and software interactions, as issues often arise from their integration. Visualization tools greatly enhance this process by presenting system data in a clear, intuitive format. By transforming complex data into visual representations, engineers can quickly identify patterns, anomalies, and root causes of issues. Visualization allows for faster pinpointing of problems, whether in hardware behavior or software execution, improving both the efficiency and accuracy of the debugging process. With visual insights, engineers can streamline troubleshooting, reduce downtime, and optimize system performance more effectively.
The complexity of embedded systems is steadily increasing as modern applications demand more powerful and specialized functions. These systems now consist of various processors, communication modules, and sensors interacting in intricate, often interconnected environments. This growing complexity presents significant challenges for engineers, especially when it comes to troubleshooting. A deep understanding of the system’s architecture and the interactions between components is crucial for identifying and resolving issues quickly. Without this knowledge, debugging becomes time-consuming and error-prone, as the root causes of failures may lie in unexpected areas of the system.
try it on Codespace
try it on local VSCode
Electronic Design Automation – Virtual Prototyping / Digital and Analogue Circuits
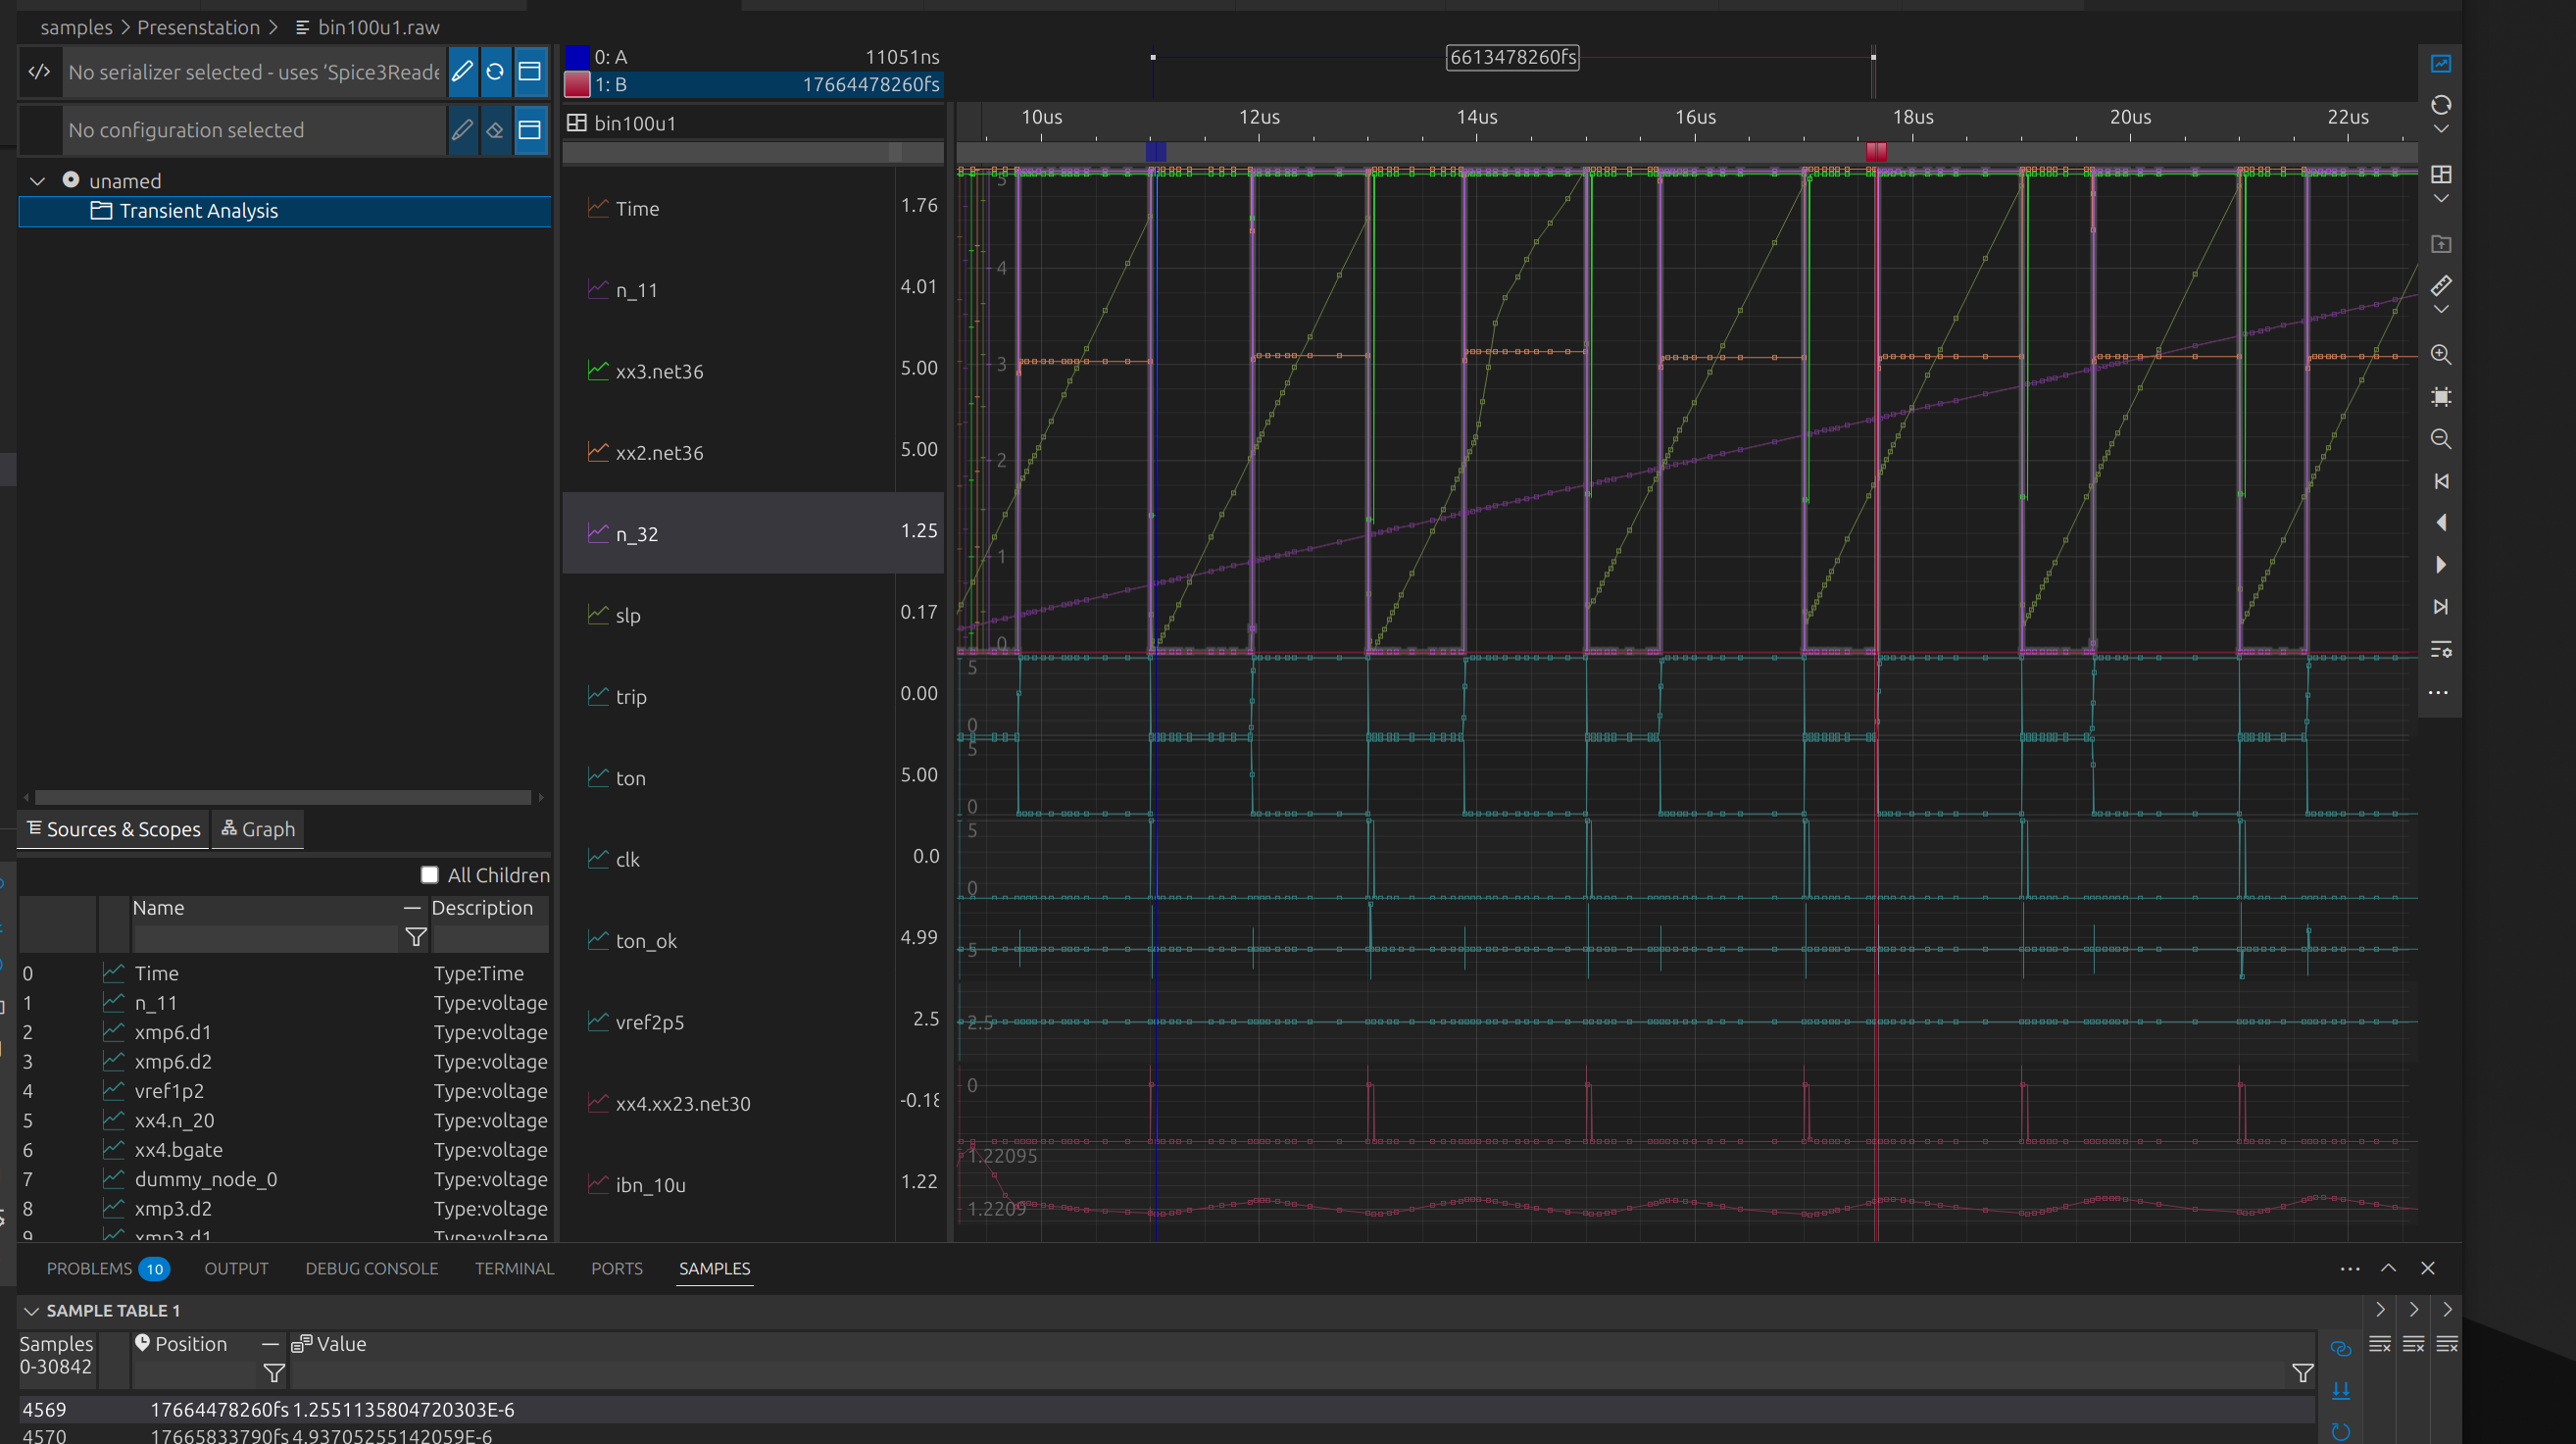
Virtual prototyping allows engineers to validate designs and implement software before creating a physical prototype. By simulating both digital and analog circuits, engineers can trace issues back to their root causes and observe how components interact. This approach accelerates development, reduces errors, and ensures more efficient system integration.
Custom Pattern and Markup Logging
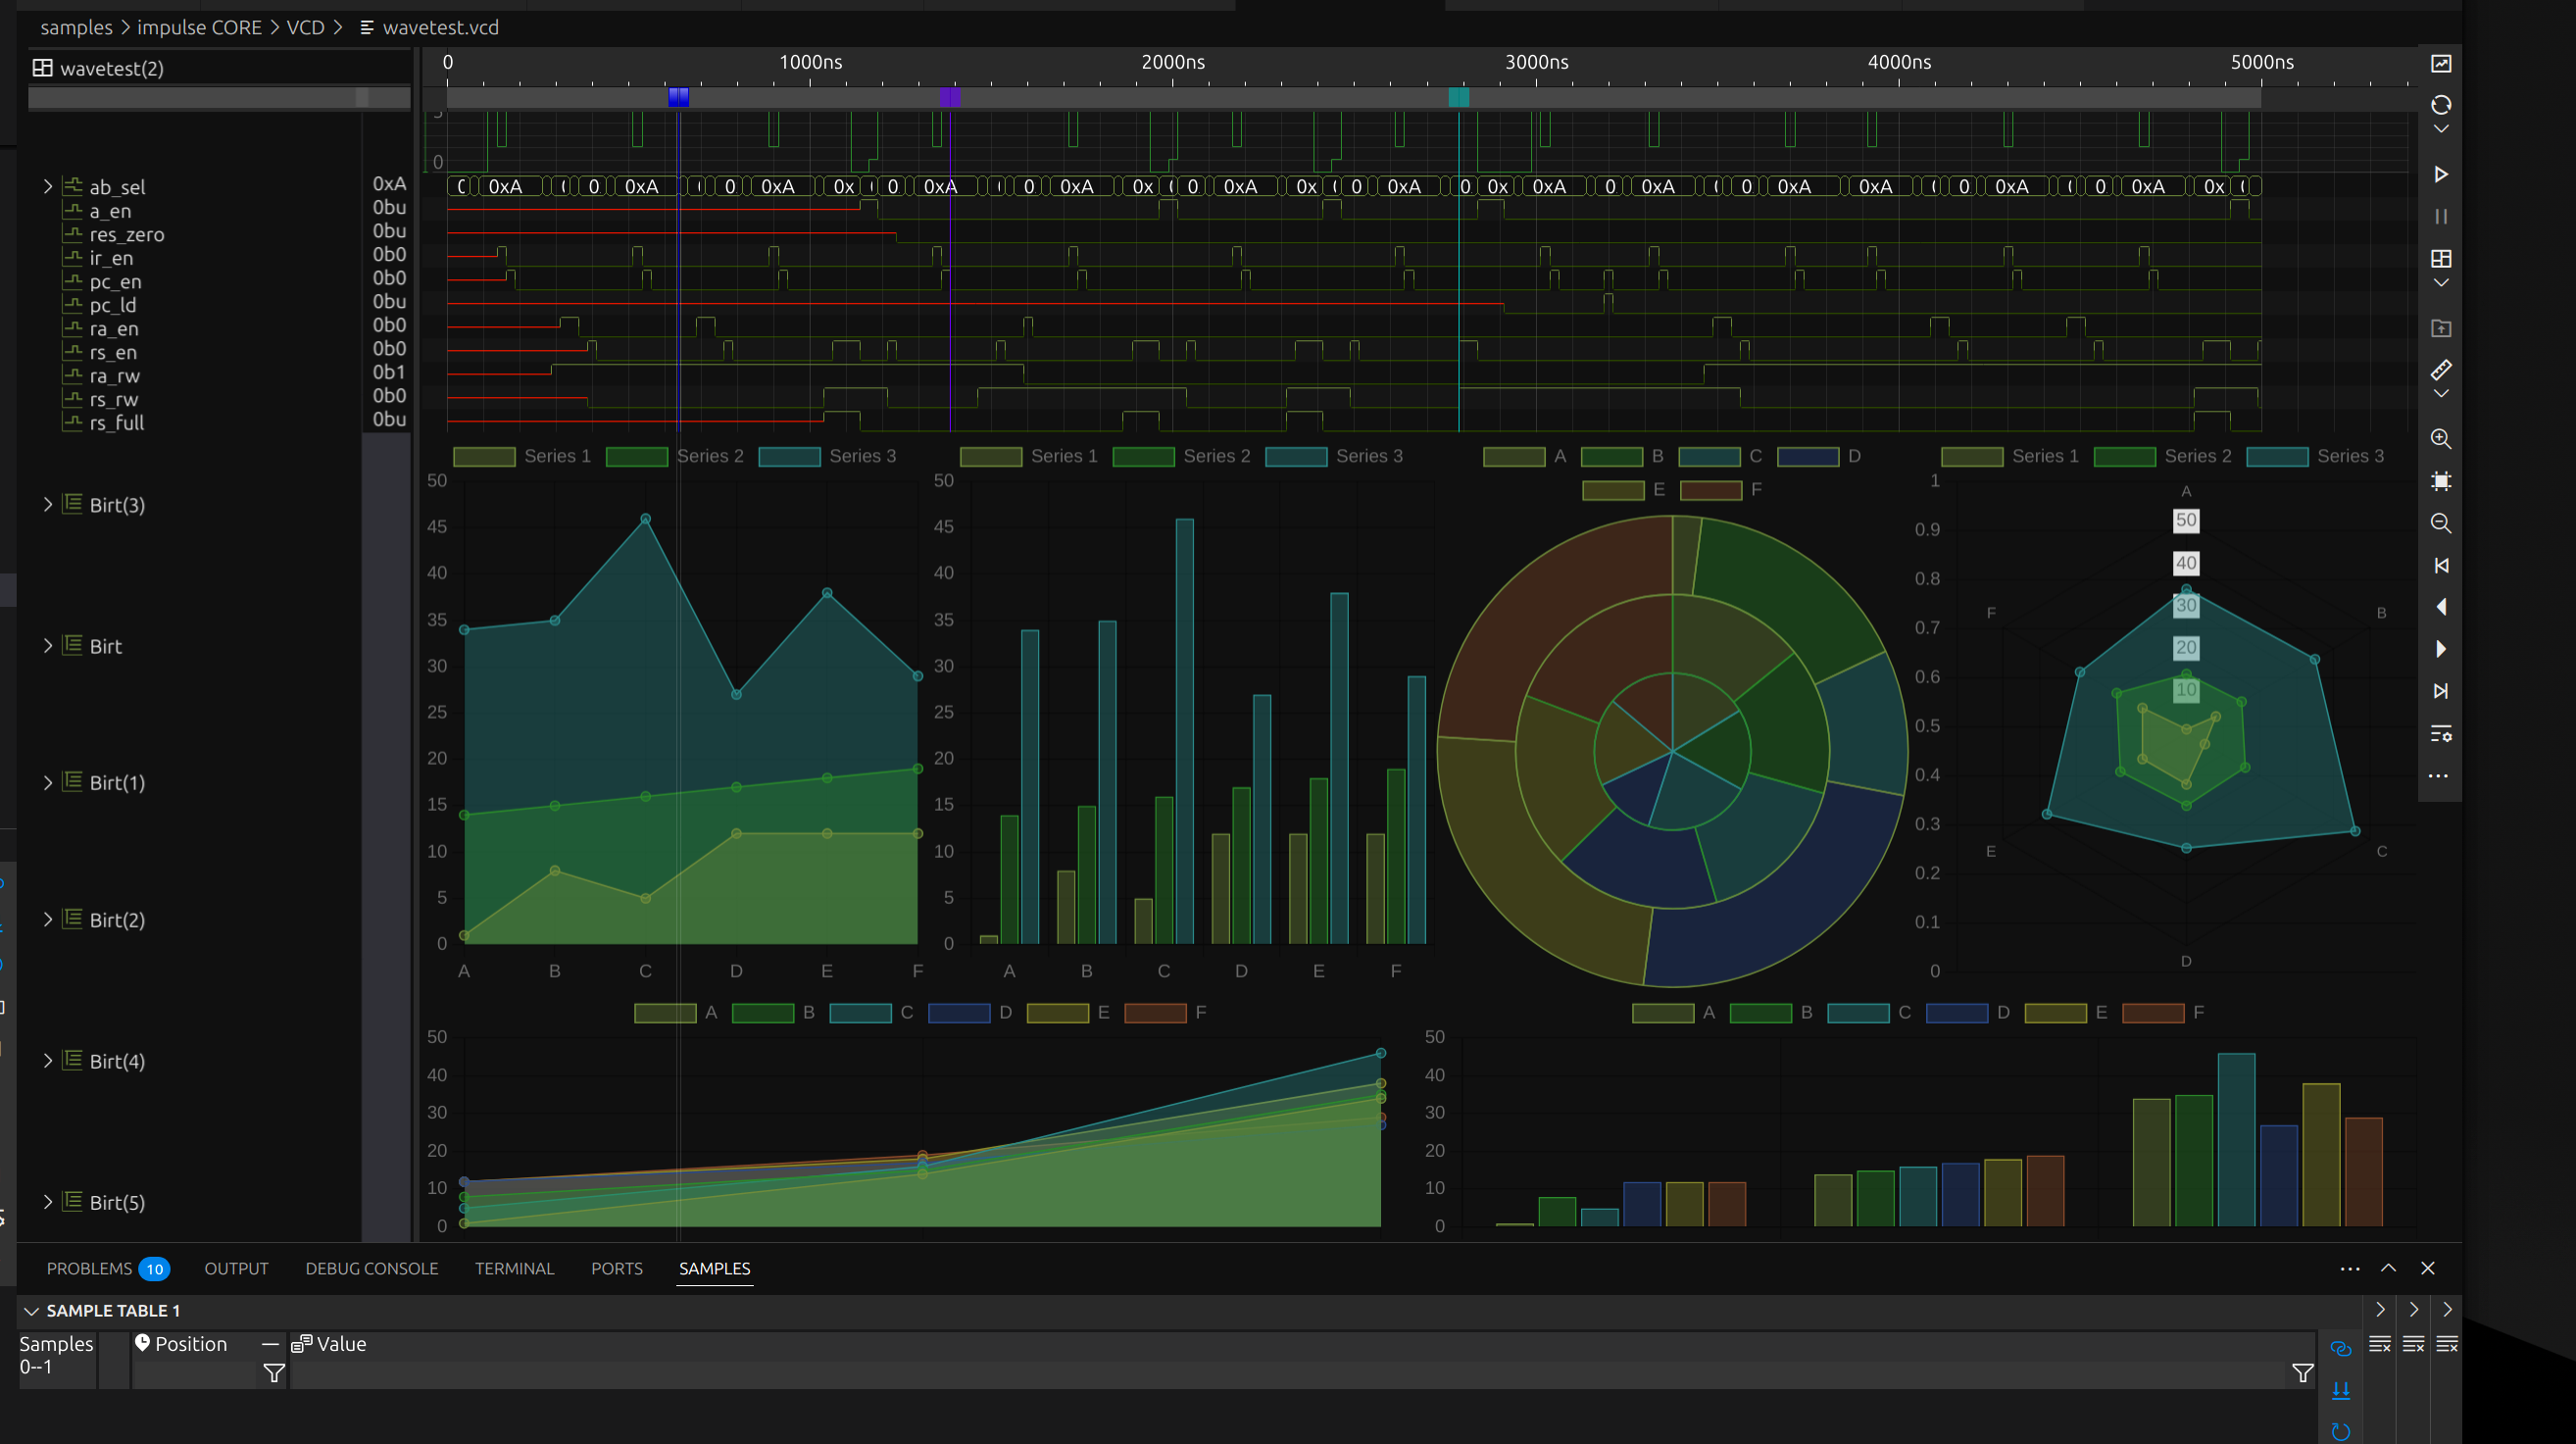
Custom pattern and markup logging helps engineers understand system communication by bundling various data streams. By using different diagram types to display message information, engineers can visualize interactions between system elements. Additionally, charts can be employed to present statistical data, offering a comprehensive view of system behavior for improved analysis and optimization.
RTOS, Single and Multicore Software Traces
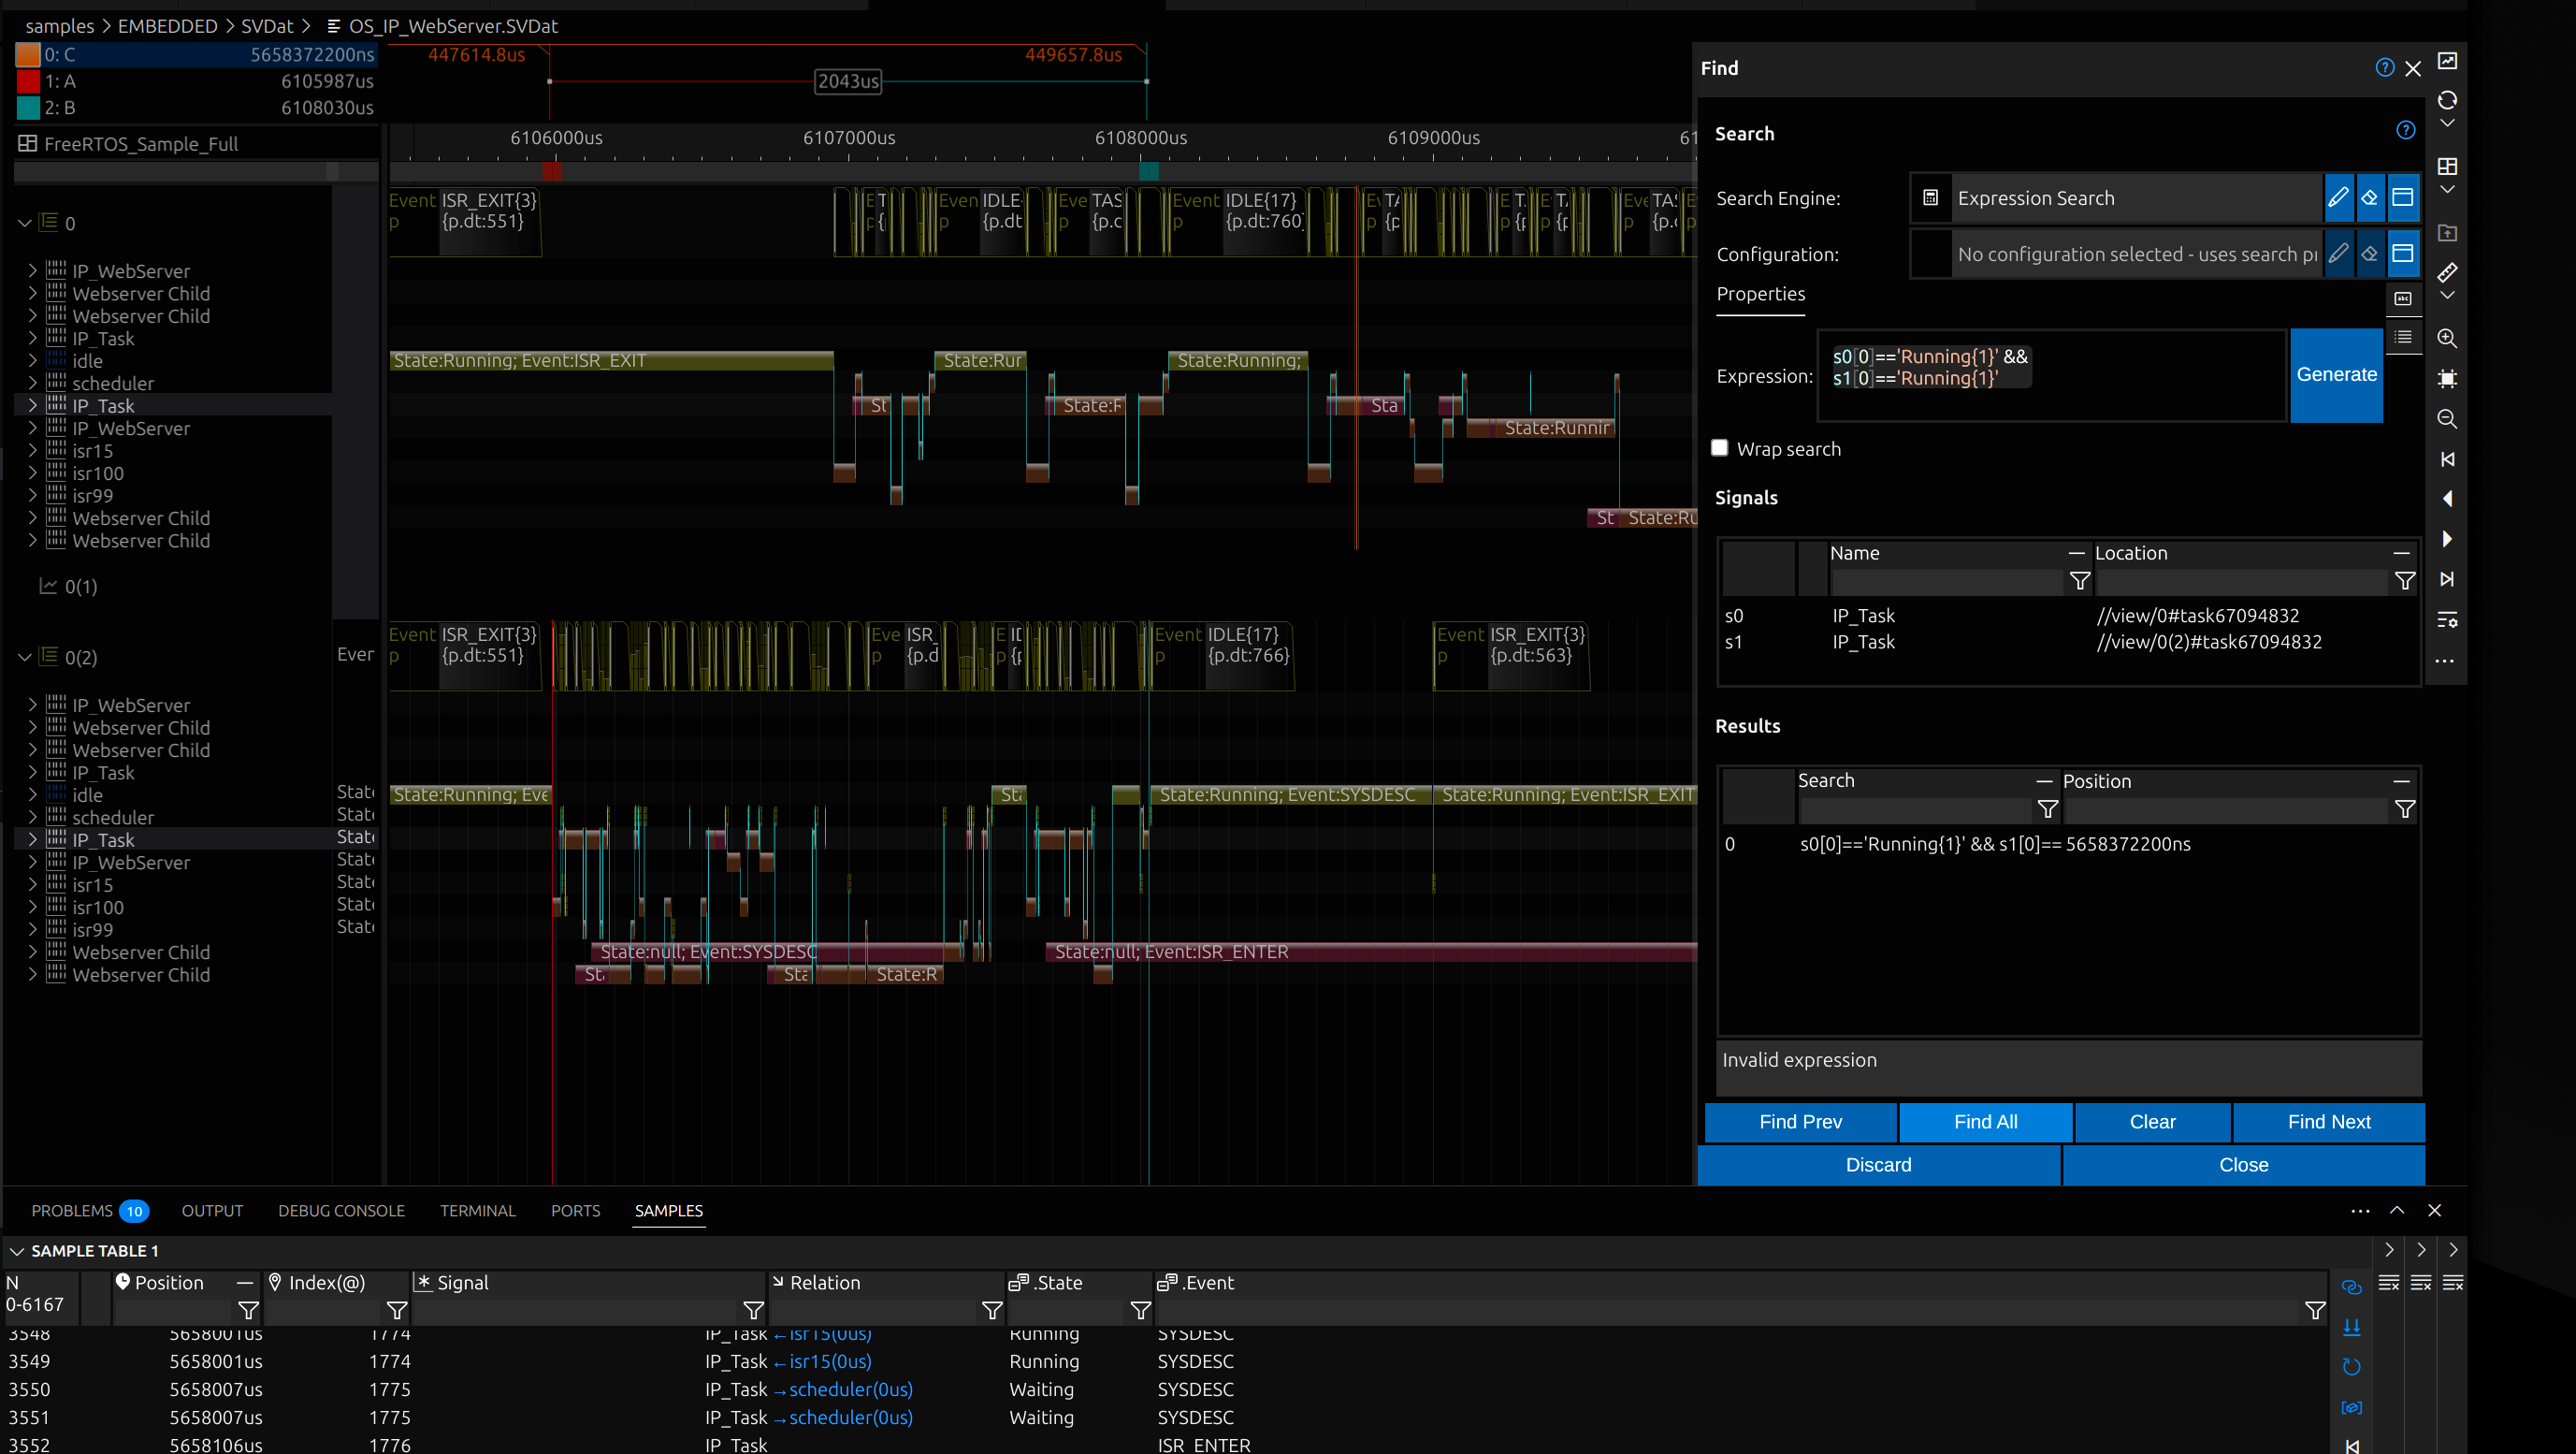
RTOS, single-core, and multi-core software traces are essential for debugging embedded systems. While multi-core processors provide high computational power, they often reduce visibility and increase the potential for errors. Impulse helps engineers navigate this complexity by offering intuitive tools to understand, trace, and debug complex semiconductor systems efficiently.
Core and IP Traces
Core and IP traces are essential for firmware programming, enabling effective troubleshooting and performance measurement. By visualizing core traces alongside source code, engineers can identify issues and optimize system behavior. Analyzing these traces allows for the generation of performance statistics, helping to fine-tune embedded systems for better efficiency and reliability.
Interfaces, Busses and other Devices
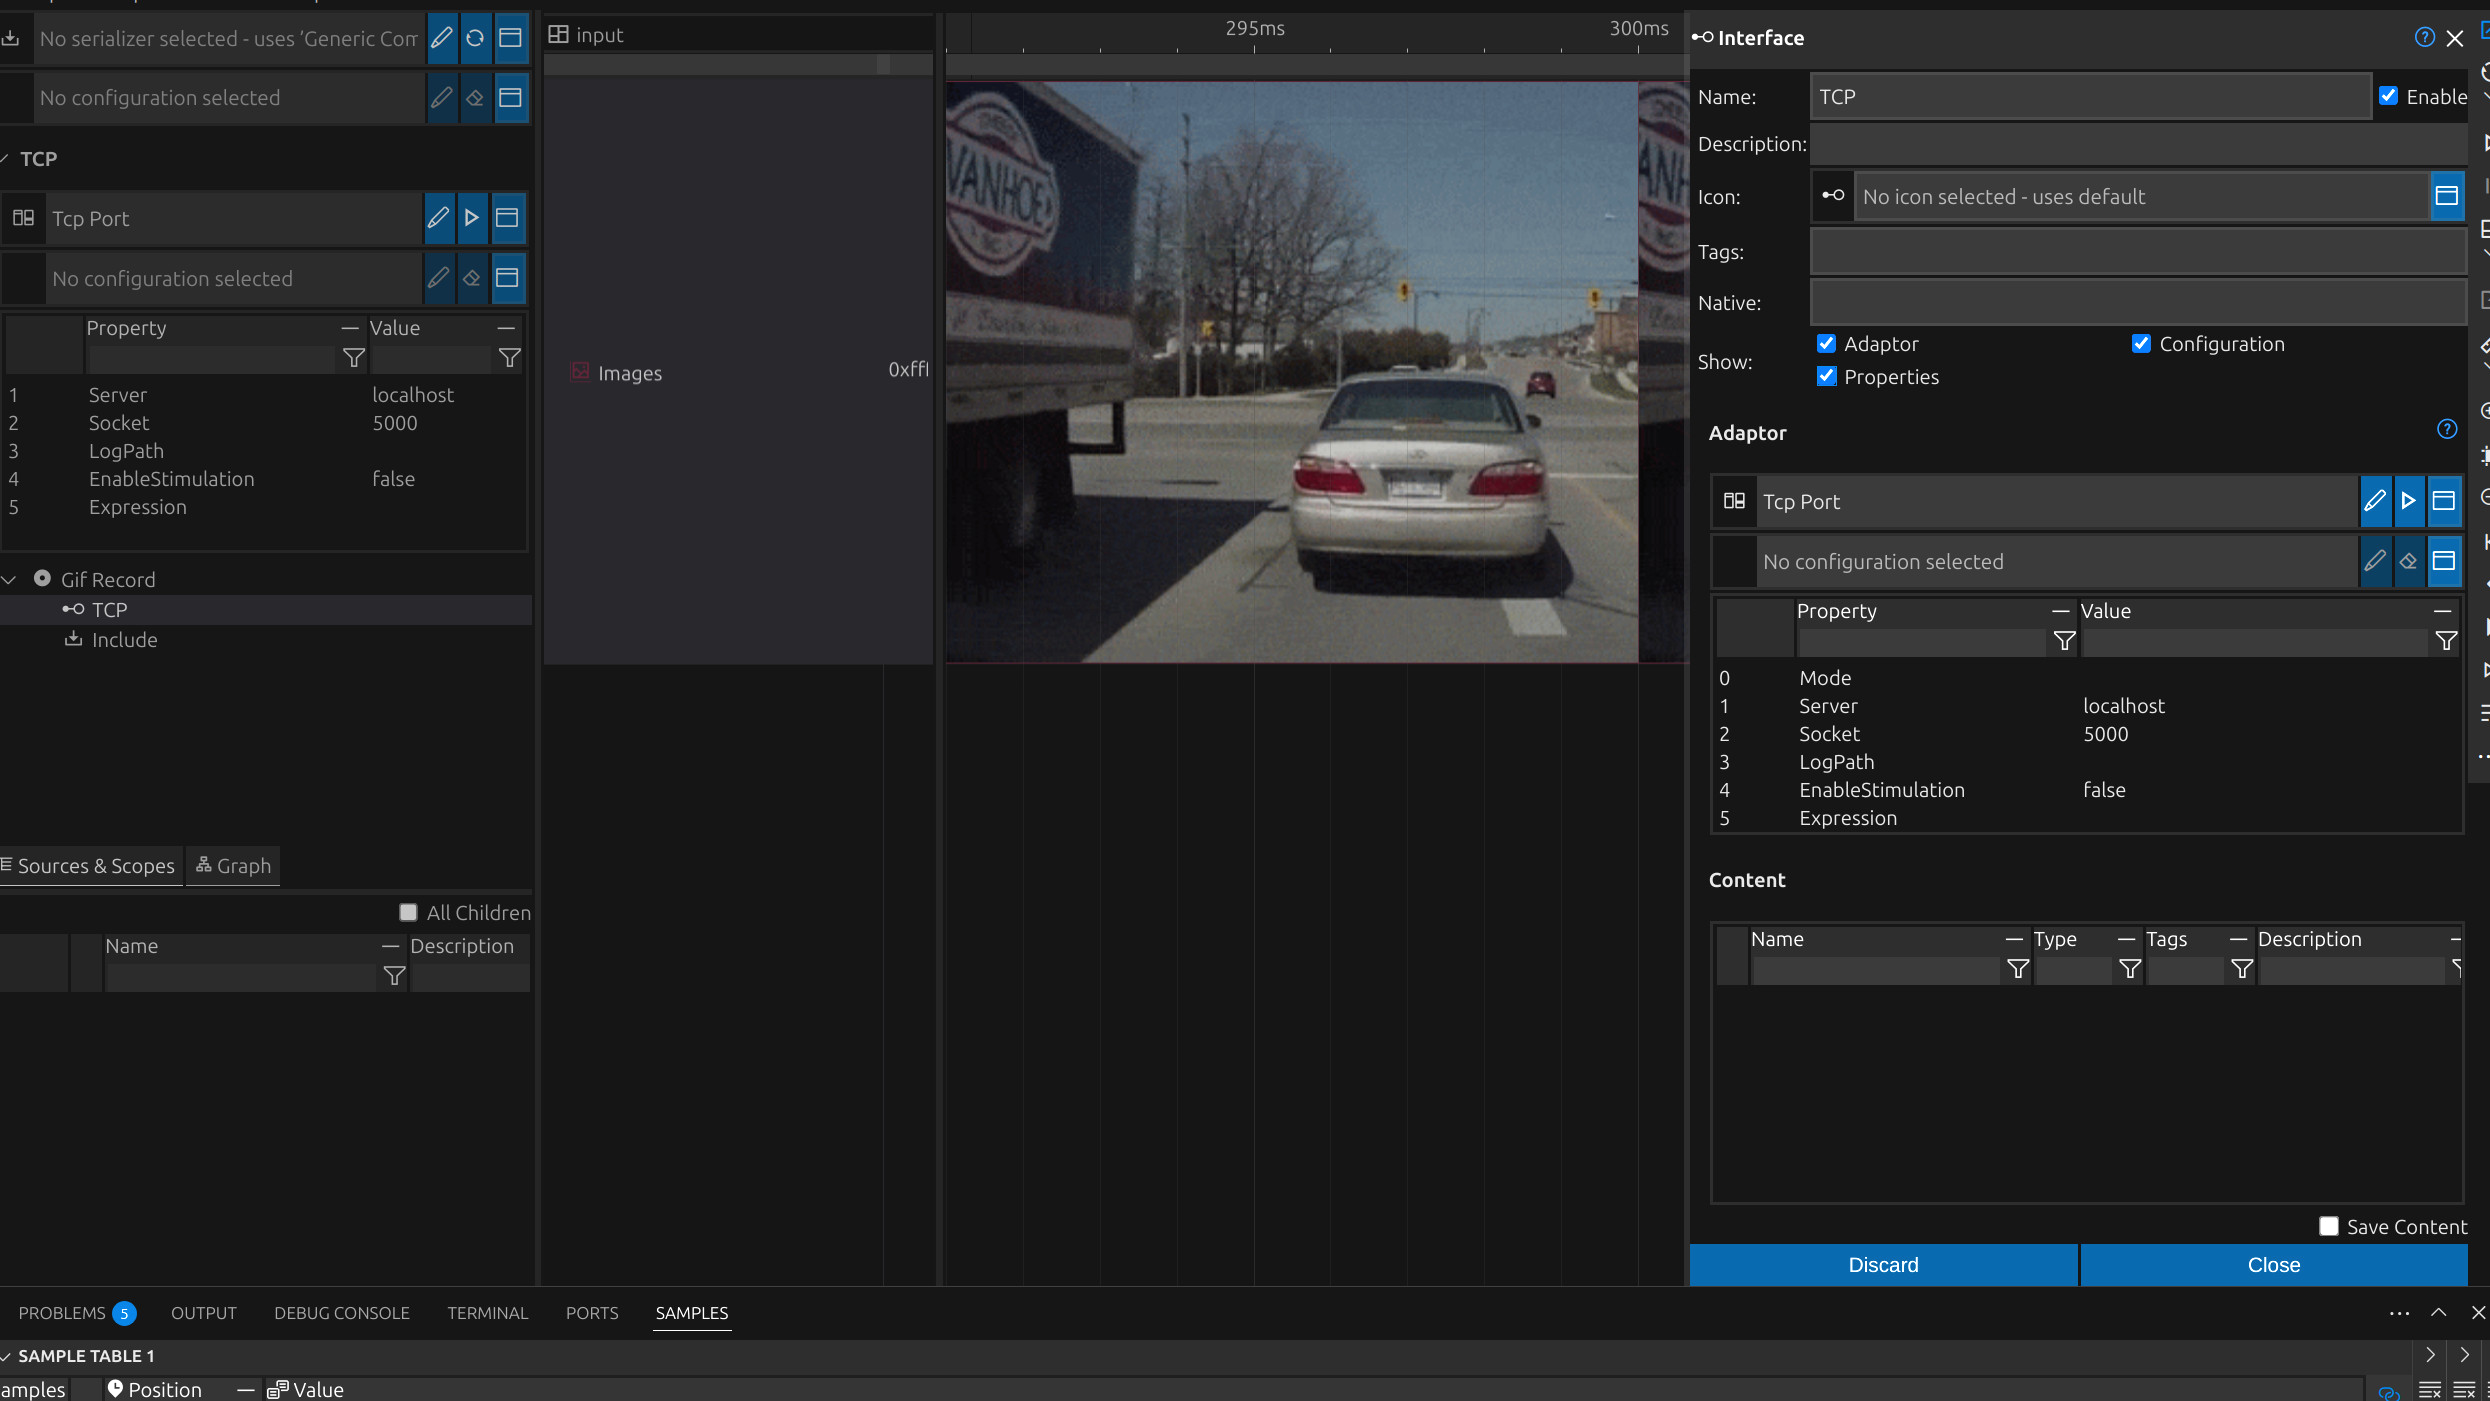
Interfaces, buses, and other devices facilitate data transfer from sensors, cameras, and measurement tools like logic analyzers and oscilloscopes. By analyzing data such as temperature, pressure, or position information, engineers can quickly identify patterns and errors without manually sifting through large datasets, improving efficiency in troubleshooting and system optimization.
System configuration / Modelling
System configuration and modeling are crucial for ensuring a system runs efficiently. Advanced tools allow engineers to edit and fine-tune configurations, providing a clear understanding of the setup. By accurately modeling the system, engineers can optimize performance, identify potential issues, and ensure the system operates as intended.
Client Server Architecture
Client-server architecture divides the workload and resources between signal-providing tasks on a simulation or application server and analysis tools on a local computer. This structure allows for efficient distribution of processing power, enabling faster data processing and analysis while keeping the local system’s resources optimized and focused on specific tasks.
bCome: Built for Configurability
The bCome framework, the foundation of all our products, is a fast, efficient, and intelligent platform independent application framework built to handle complex configuration tasks. It simplifies the setup and management of intricate systems through an intuitive structure that enhances user interaction and streamlines configuration workflows—making advanced system tasks more accessible and manageable.
Open Engineering
Serialization, visualization, and calculation blocks can be sourced from or linked to public repositories, enabling seamless exchange and synchronization. This approach allows engineers to incorporate community-driven components, extend functionality, and maintain a flexible, modular system architecture tailored to evolving development and analysis needs.
Insight Built into VSCode
VSCode, one of the most popular IDEs, is enhanced by our VSCode plugin, allowing you to analyze results effortlessly within your development environment. This seamless integration provides real-time insights, streamlining the debugging and analysis process directly in VSCode, improving productivity and making complex tasks more manageable.
Ready for Web-Based Workflows
Web IDE integration allows you to analyze logs, traces, and simulation data directly within your preferred web-based IDE. There’s no need to transfer large data files or rely on local tools, streamlining the workflow and providing seamless access to critical information, enhancing efficiency and simplifying analysis tasks.
Custom HTML applications
Custom HTML applications, built on the bCome framework, combine a lightweight JavaScript frontend with a powerful Java backend to deliver high-performance, web-based analysis tools. This architecture ensures fast, responsive user interfaces while efficiently handling complex data processing and analysis tasks in the backend—providing a seamless and scalable solution for evaluating intricate systems.
Natural Language Access
Custom Extensions Without the Overhead
Extensions can be implemented directly within the IDE—no need for development experience or external tool setup. This accessible approach allows users to tailor data capture, processing, and visualization to their specific needs. From custom formats to new views, extensions streamline workflows and make advanced customization simple and intuitive for engineers at every level.
Extend or Integrate
impulse provides open extension mechanisms that allow for complete customization to meet specific user needs. Users can define custom data formats, ensuring compatibility with their unique systems, and implement acquisition interfaces for seamless data collection. The platform supports the creation of tailored diagrams and specialized data analysis tools to provide deeper insights. For further flexibility, impulse can be integrated into custom IDEs and applications, ensuring that it fits seamlessly within existing development workflows. These extension and integration options make impulse adaptable to a wide range of use cases and industries.

Open Interfaces
Impulse offers a consistent extension mechanism with open interfaces, enabling seamless adaptation to any environment. With adaptable templates, users can easily develop their own extensions, tailoring the platform to specific needs. This flexibility ensures smooth integration, making it simple to customize and expand Impulse for diverse applications.
Extend to your needs
impulse offers the flexibility to be extended according to your specific requirements. Whether it’s customizing data formats, integrating new interfaces, or developing specialized visualizations, you can tailor the platform to suit your unique needs. This adaptability ensures Impulse remains effective and efficient for any project or application.
Integrate into Your Product
Integrating impulse into external products, such as a customized IDE, enables seamless data visualization and enhances functionality. This integration accelerates time to market and offers exciting possibilities for your customers, providing them with a more intuitive and efficient experience while ensuring smooth compatibility with your product ecosystem.
Services
We Help You Get the Most Out of Our Products.
We are dedicated to ensuring you get the best value from our products. From handling simple user requests and providing training to offering development services and supporting complex product integrations, we are here to assist every step of the way, ensuring optimal performance and success.
Trainings
We offer comprehensive training courses both online and onsite, tailored to meet your needs. Our expert-led sessions cover everything from basic to advanced topics, ensuring you gain the knowledge and skills to maximize the potential of our products. Whether remote or in-person, we provide flexible learning options.
Application Consulting
Our application consulting services guide you in realizing your visualization application. We work closely with you to understand your needs, offering expert advice and solutions tailored to your specific requirements. Whether it’s optimizing functionality or integrating new features, we ensure your application meets your goals efficiently.
Development Services
Our development services offer custom extensions tailored to your specific needs. We handle everything from creation to deployment, ensuring seamless integration with your systems. Upon request, we also manage licensing and deployment processes, allowing you to focus on your core tasks while we take care of the technical details.
