impulse
Understand – Debug – Analyse — from inside of your IDE.
impulse is a powerful visualization and analysis workbench designed to help engineers understand, analyze, and debug complex semiconductor and multi-core software systems. It provides seamless integration into IDE frameworks and enables interoperability with a growing set of extensions, such as language IDEs and reporting tools
With its client-server architecture, impulse divides workloads between signal-providing tasks (on a simulation or application server) and local analysis tools, ensuring efficient performance. Engineers can use their favorite web IDE to analyze logs, traces, and simulation data without transferring large amounts of data or relying on local tools.
impulse’s open extension mechanisms allow users to adapt it to their specific needs. Whether defining custom data formats, implementing acquisition interfaces, creating specialized diagrams, impulse offers unparalleled flexibility. Its lightweight frontend and powerful Java backend enable the creation of high-performance, complex analysis applications.
Attach
Get Data from Anywhere
impulse offers a wide range of data formats and external interfaces through signal adaptors, providing a unified view of various data sources. Whether reading signals from log, wave, or trace files, or accessing live data streams, users can seamlessly integrate data from multiple channels. Signal adaptors enable direct connections to sources such as TCP streams, pipes, applications, external networks, serial interfaces, and data acquisition units. When dealing with multiple signal sources—such as log data from a serial interface and trace data over TCP—impulse can merge and synchronize them, ensuring accurate, comprehensive analysis across diverse systems and interfaces.
Read from a Workspace Resource
By double-clicking a workspace resource, the corresponding reader is instantly selected, and the viewer opens. Users can easily adjust the time frame or apply filters to focus on specific signals. Optional configurations allow for tailored views, providing flexibility to examine data with precision and efficiency.
Read from Data Interface, Application or External HW
impulse’s flexible signal adaptors enable connections to any signal source, whether through simple data interfaces, configurable readers, external libraries, or complex hardware setups. This adaptability ensures that users can easily integrate and analyze data from a wide variety of applications and external hardware, enhancing overall system versatility.
Combine and Synchronize Multiple Inputs
Impulse allows users to combine multiple signal ports of different types into a single synchronized input. This synchronization ensures seamless integration of diverse signals, enabling precise analysis and correlation across various data sources. The ability to merge and align inputs enhances clarity and accuracy in complex signal analysis.
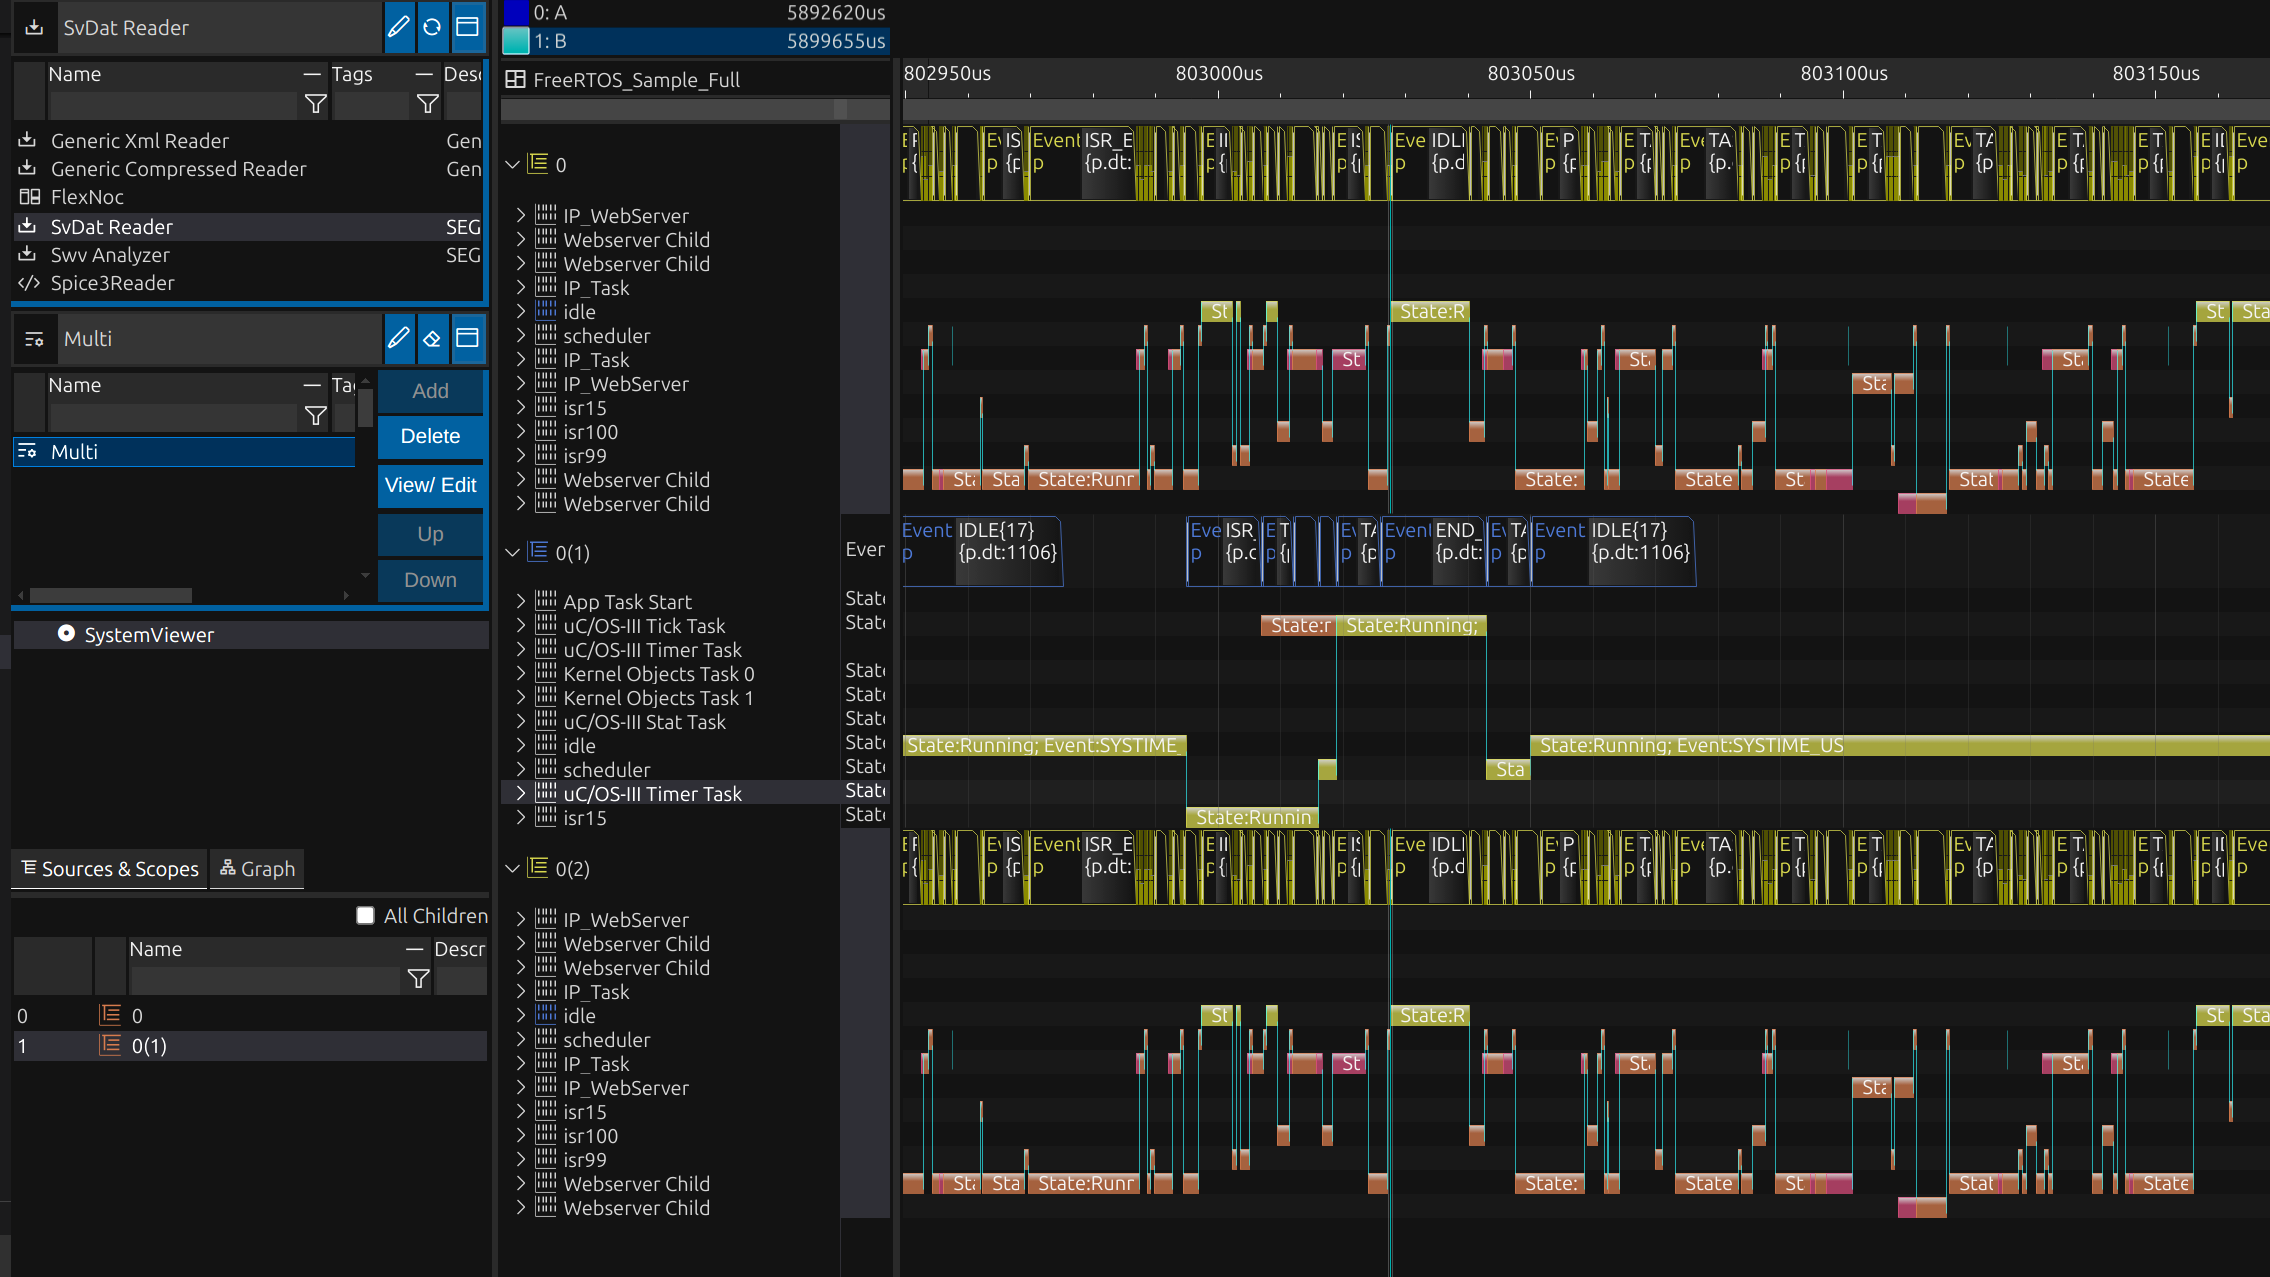
Read from a Workspace Resource
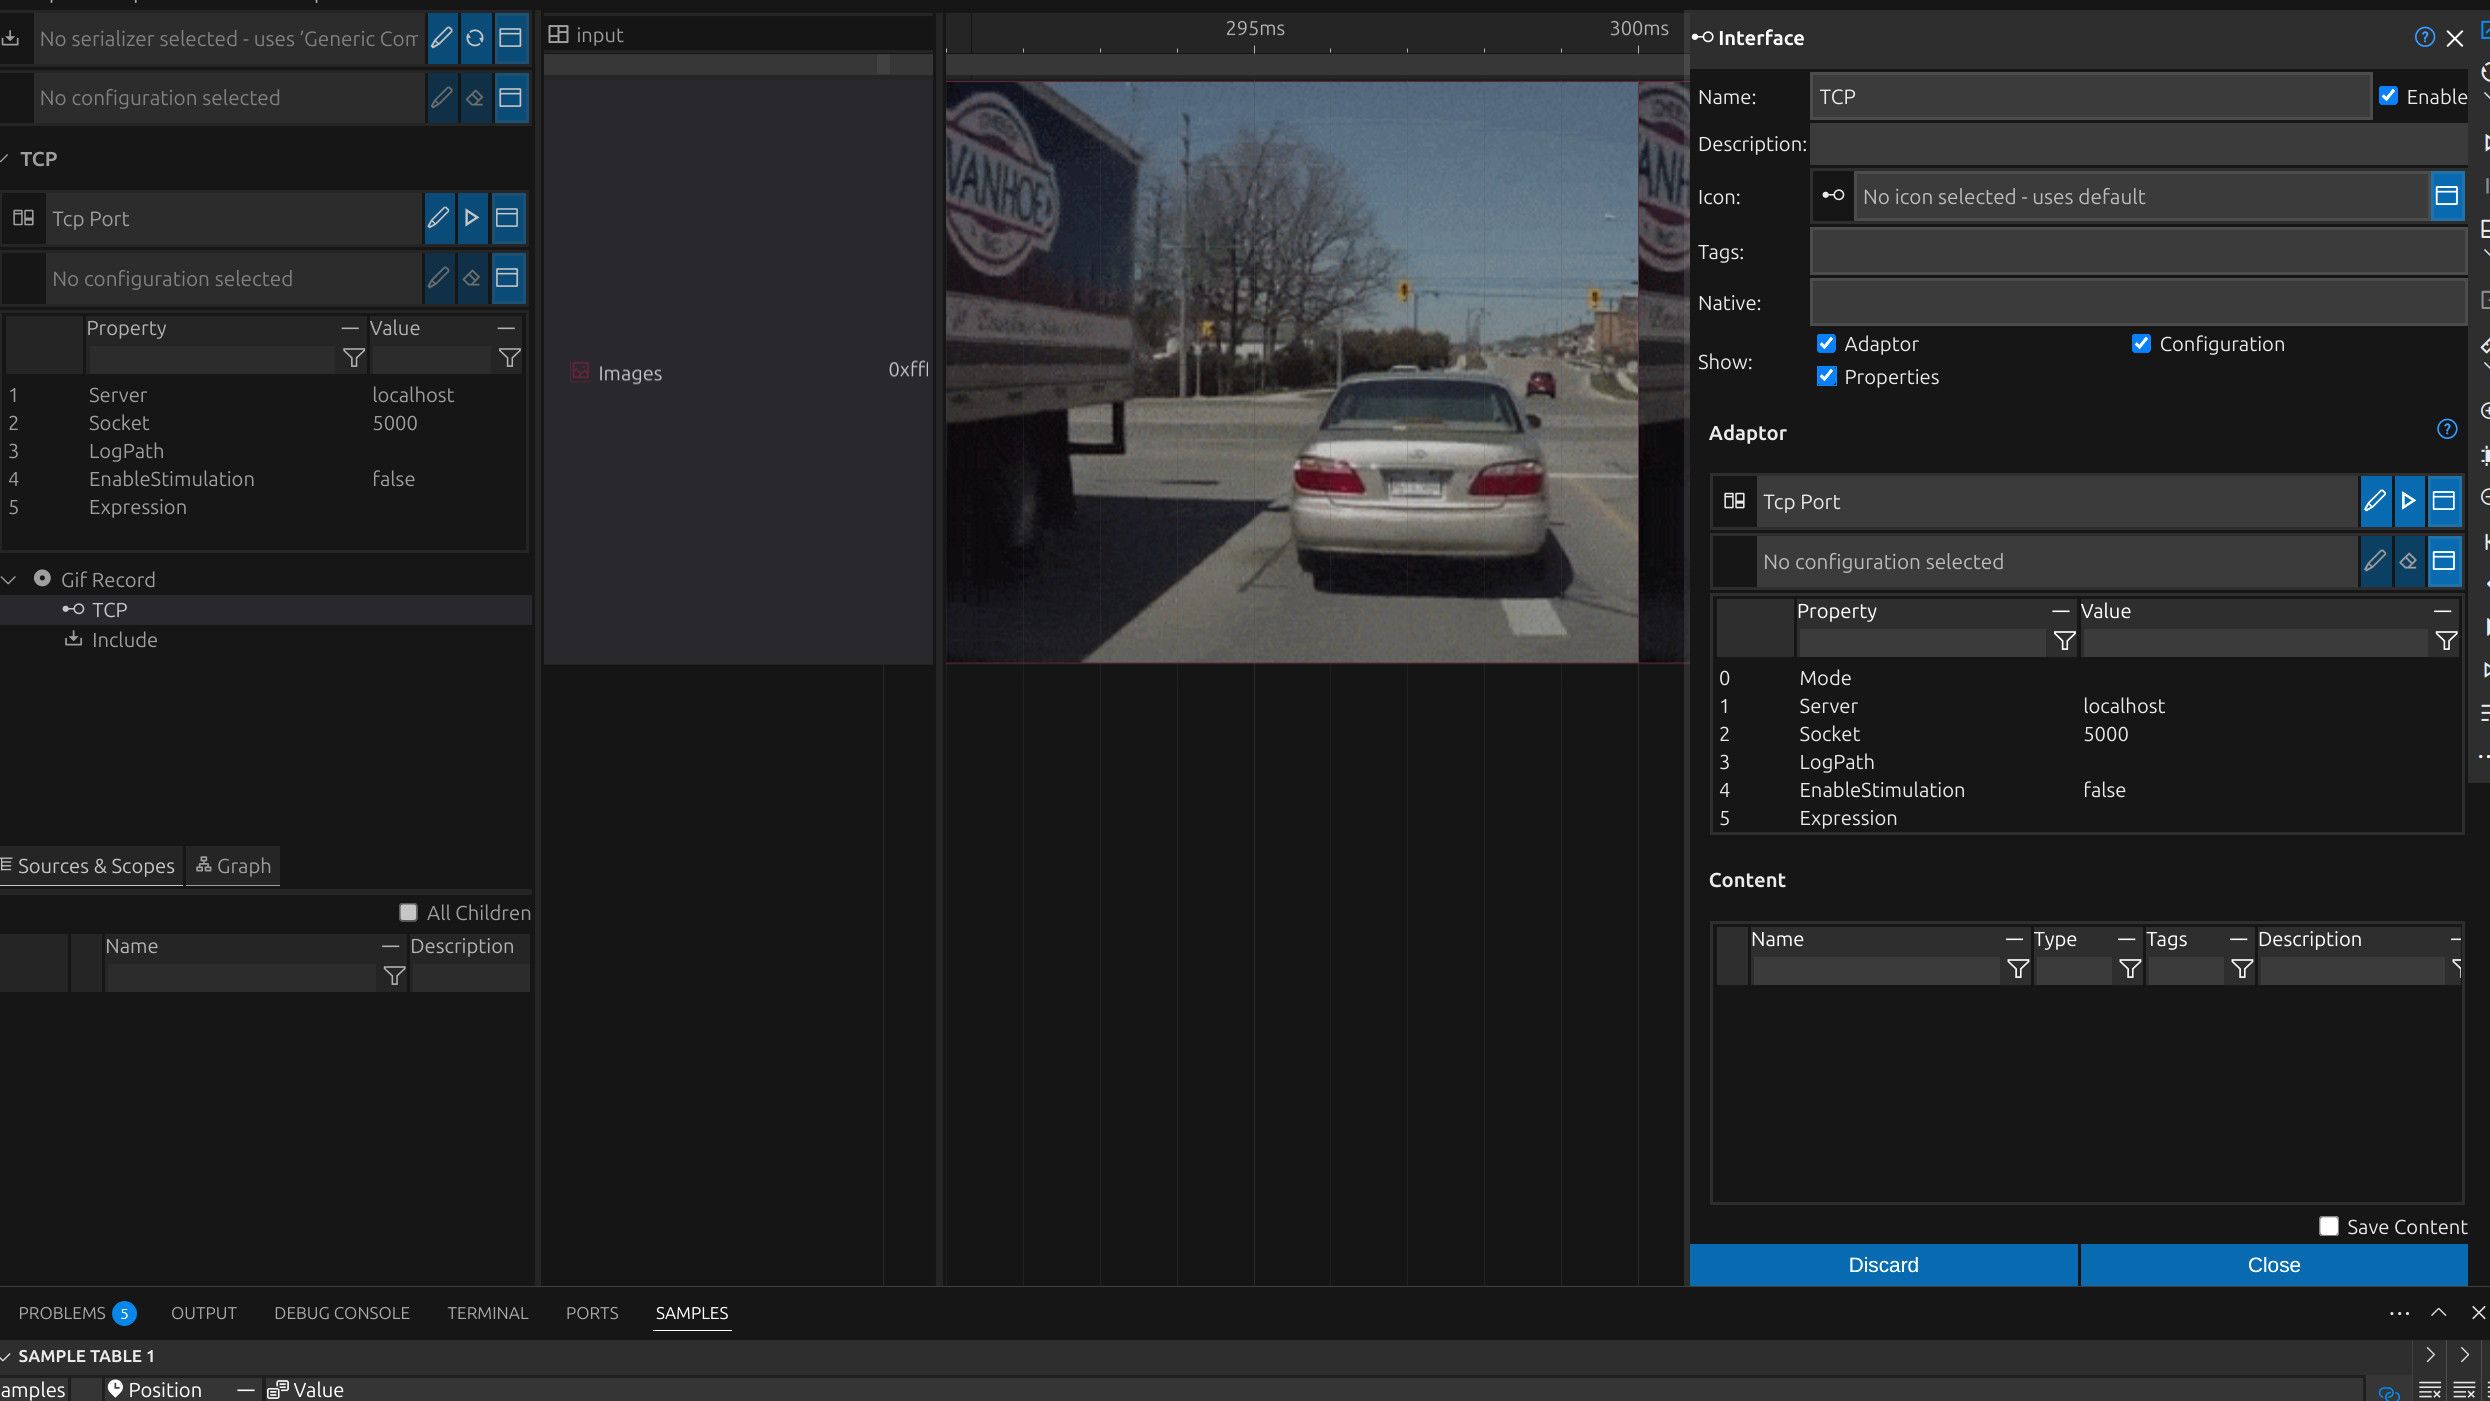
Read from Data Interface, Application or External HW
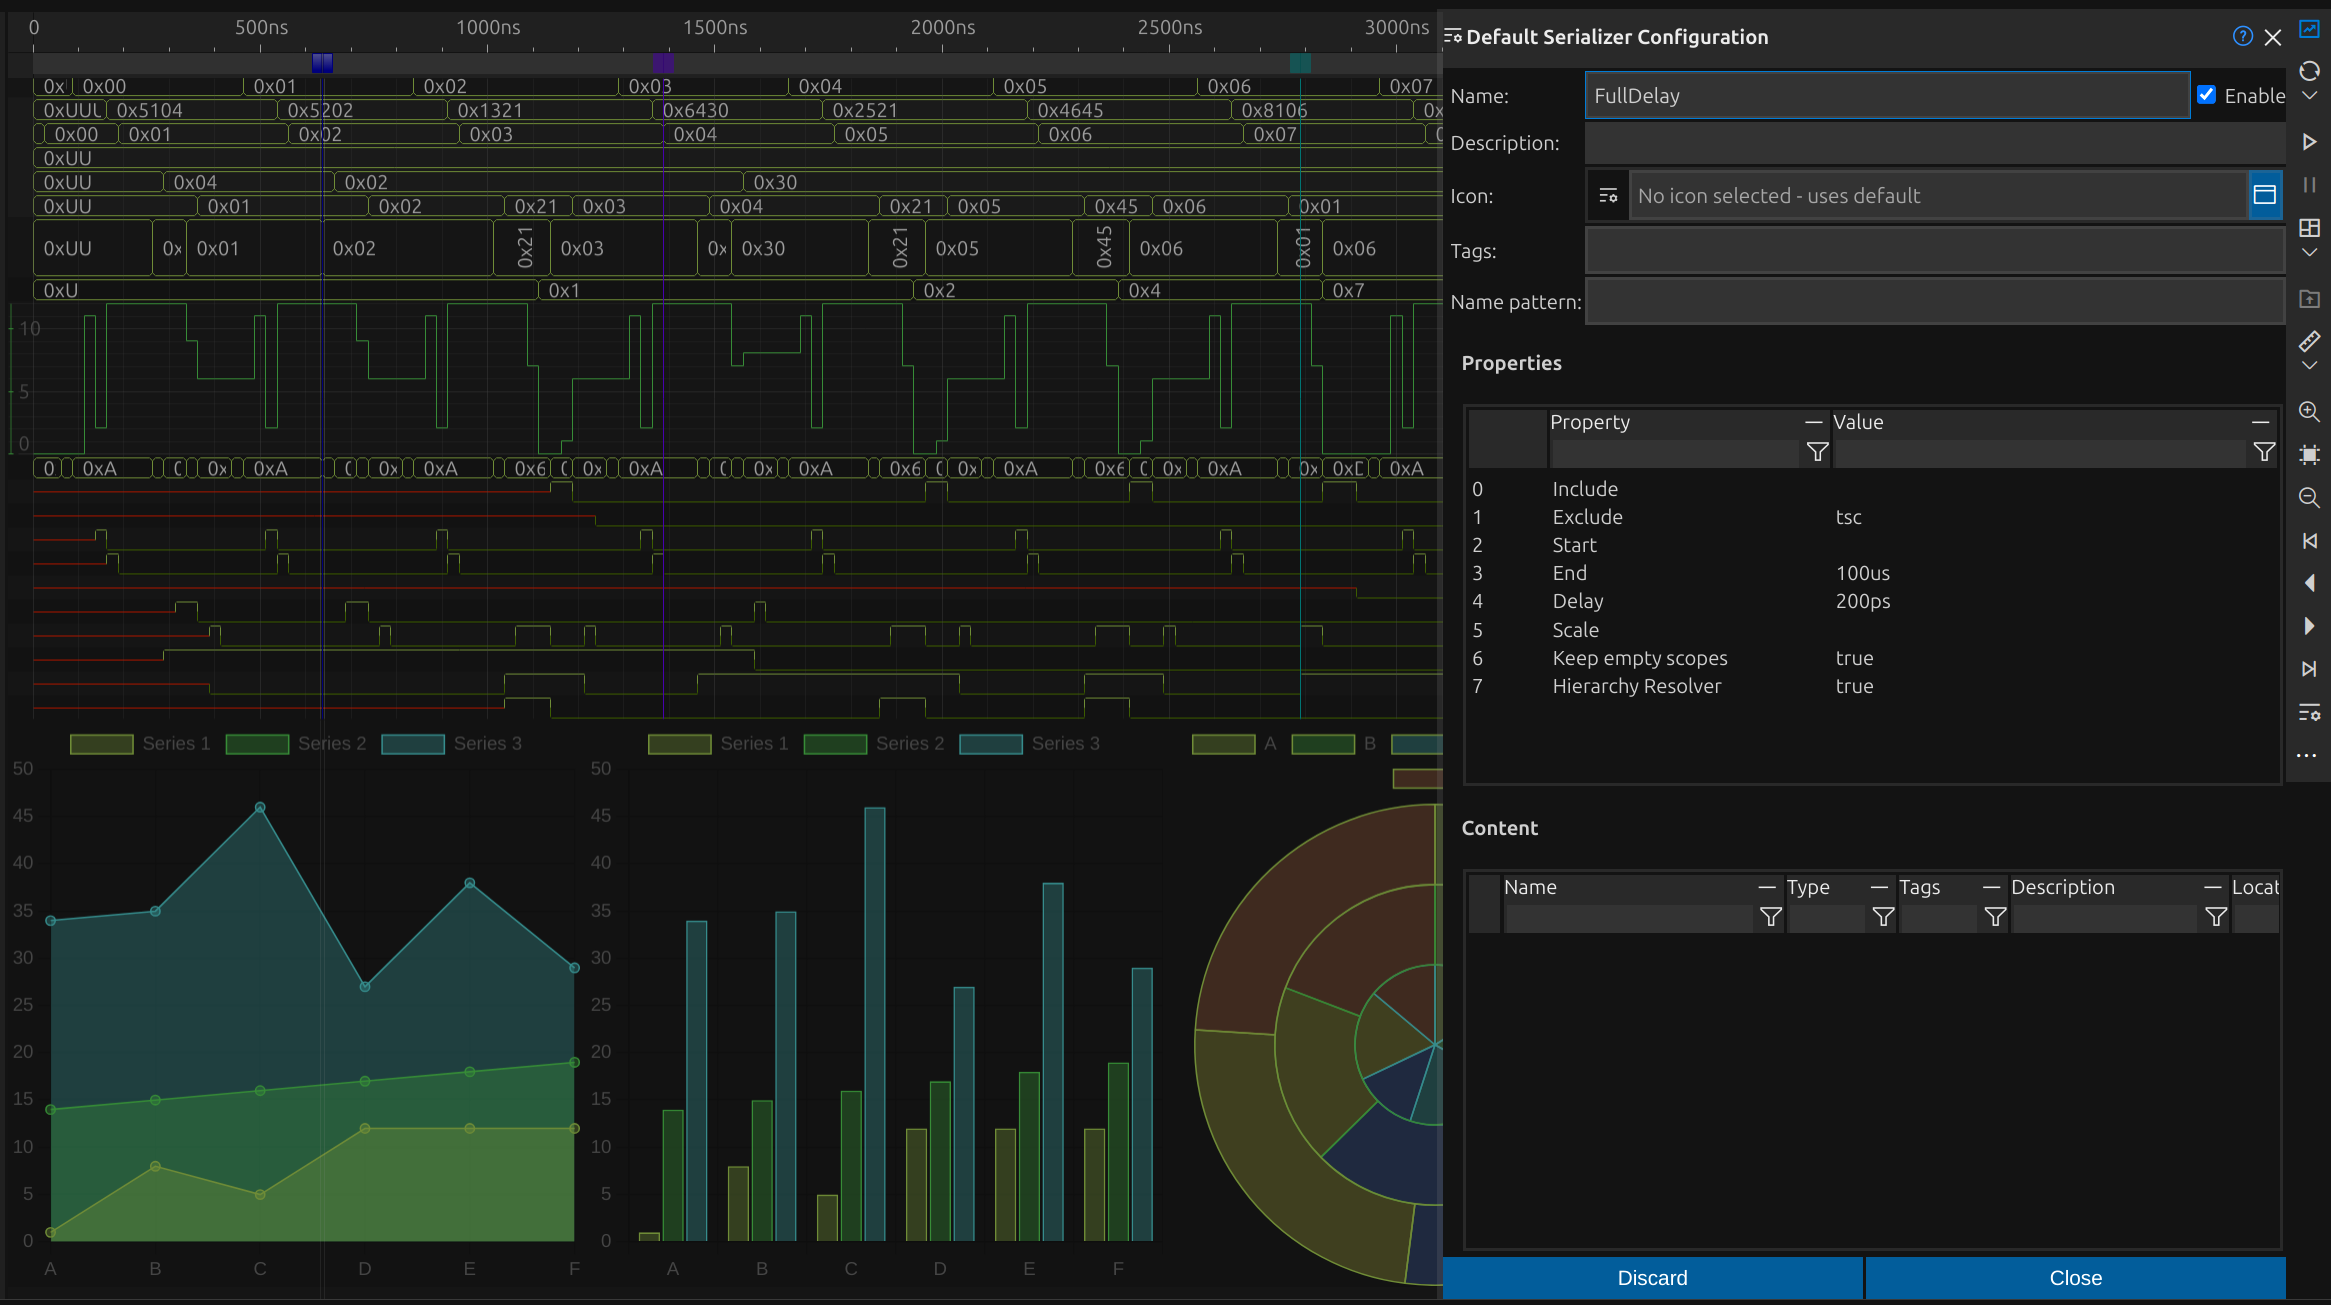
Combine and Synchronize Multiple Inputs
Signals and Samples
Signals are value changes (samples) in relation to a specific domain (e.g., time), which can be represented in a real application as log or trace data over time, a transformation result over frequency or statistical data over an index.
Discrete or Continuous
Value changes (samples) can be at any point (discrete), even several at one point, or continuously at a fixed rate.
Multiple Domains
This could be time, date, frequency, index, voltage, current or generic etc.
Streams
Signals may grow over time to support online data visualization.
Relations and Labels
Signal samples may have a relation to a position in the same signal or any other signal. Labels may also be attached to a sample.
Source Graph
A graphical representation of the source signals and scopes makes it easy to navigate, find and understand.
Grouped Samples
Samples may be grouped, for example, transactions where at least two samples (start and end) cover a period.
Signal Types
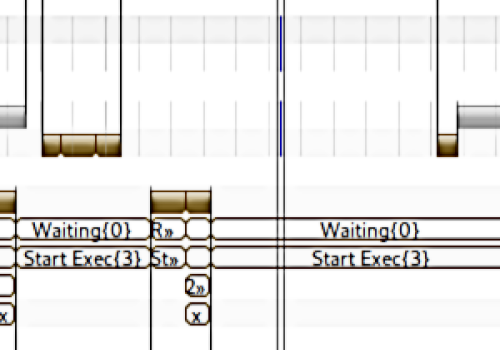
Event/ Enumeration
Enumeration values consist of an integer value and its text representation.
Typical uses cases: Digital simulation, logic analyzers, logs and traces.
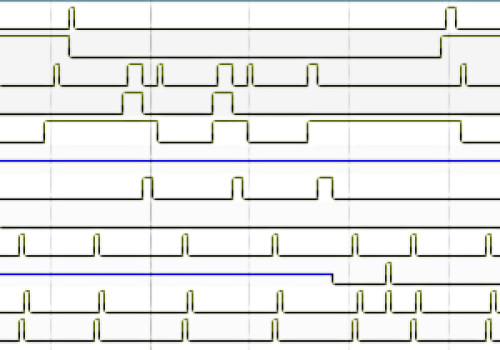
Logic
Logic values consist of 1…N bits. The bits are stored as 2-, 4- or 16-state data (normally nine states are used).
Typical uses cases: Digital simulation, logic analyzers.
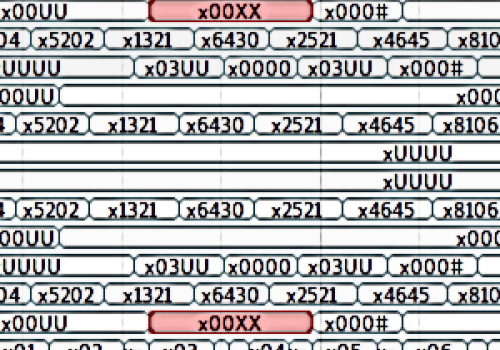
Integer
Integer value of any size.
Typical uses cases: Digital simulation, scopes, logs and traces.
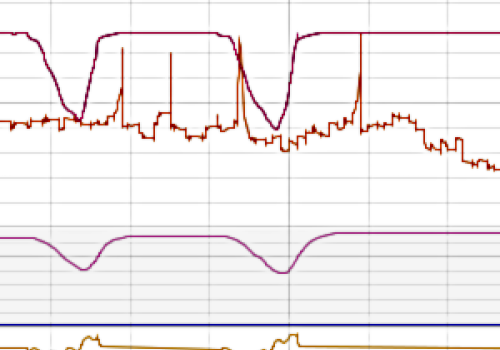
Float
32- or 64-bit real values.
Typical uses cases: Analouge simulation, scopes, logs and traces.
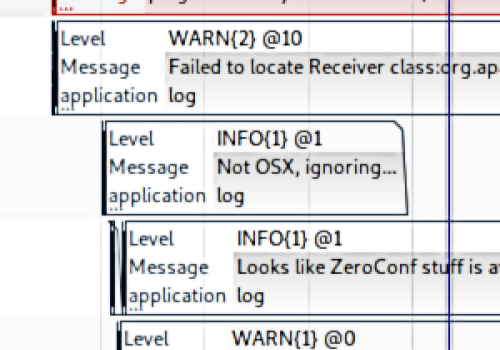
Text
Text values of any size.
Typical uses cases: Logs.
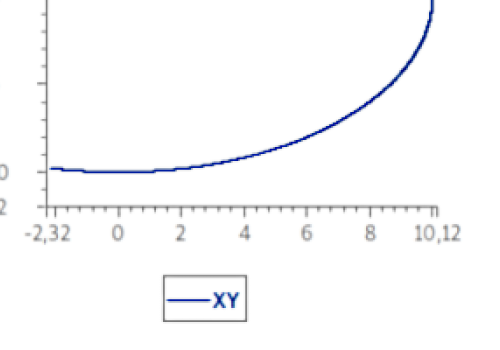
Arrays

Struct
Structured data with elements of type Text, Integer, Float, Binary and Enumeration.
Typical uses cases: Logs , traces.
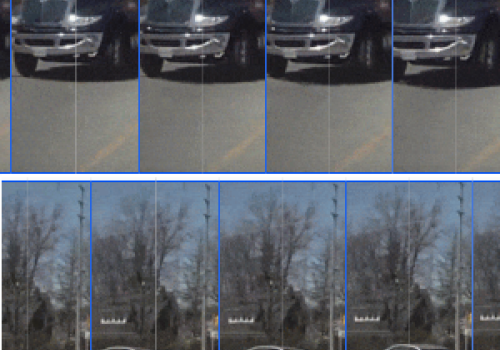
Binary
Binary data of any size.
Typical uses cases: Image data.
View
Present Your Way
Every development process is unique, and every developer has a distinct workflow. With impulse, users can customize their views to match their specific needs, ensuring an efficient and intuitive experience. The user-friendly interface keeps the focus on signal data rather than the tool itself. Powerful visualization elements enable the creation of informative, tailored displays. Choose from various diagram types to represent signals across different domains, such as time and frequency, or use charts to present statistical insights. This flexibility allows for clear, precise data interpretation, enhancing analysis, debugging, and overall system understanding with a personalized approach.

Your point of view
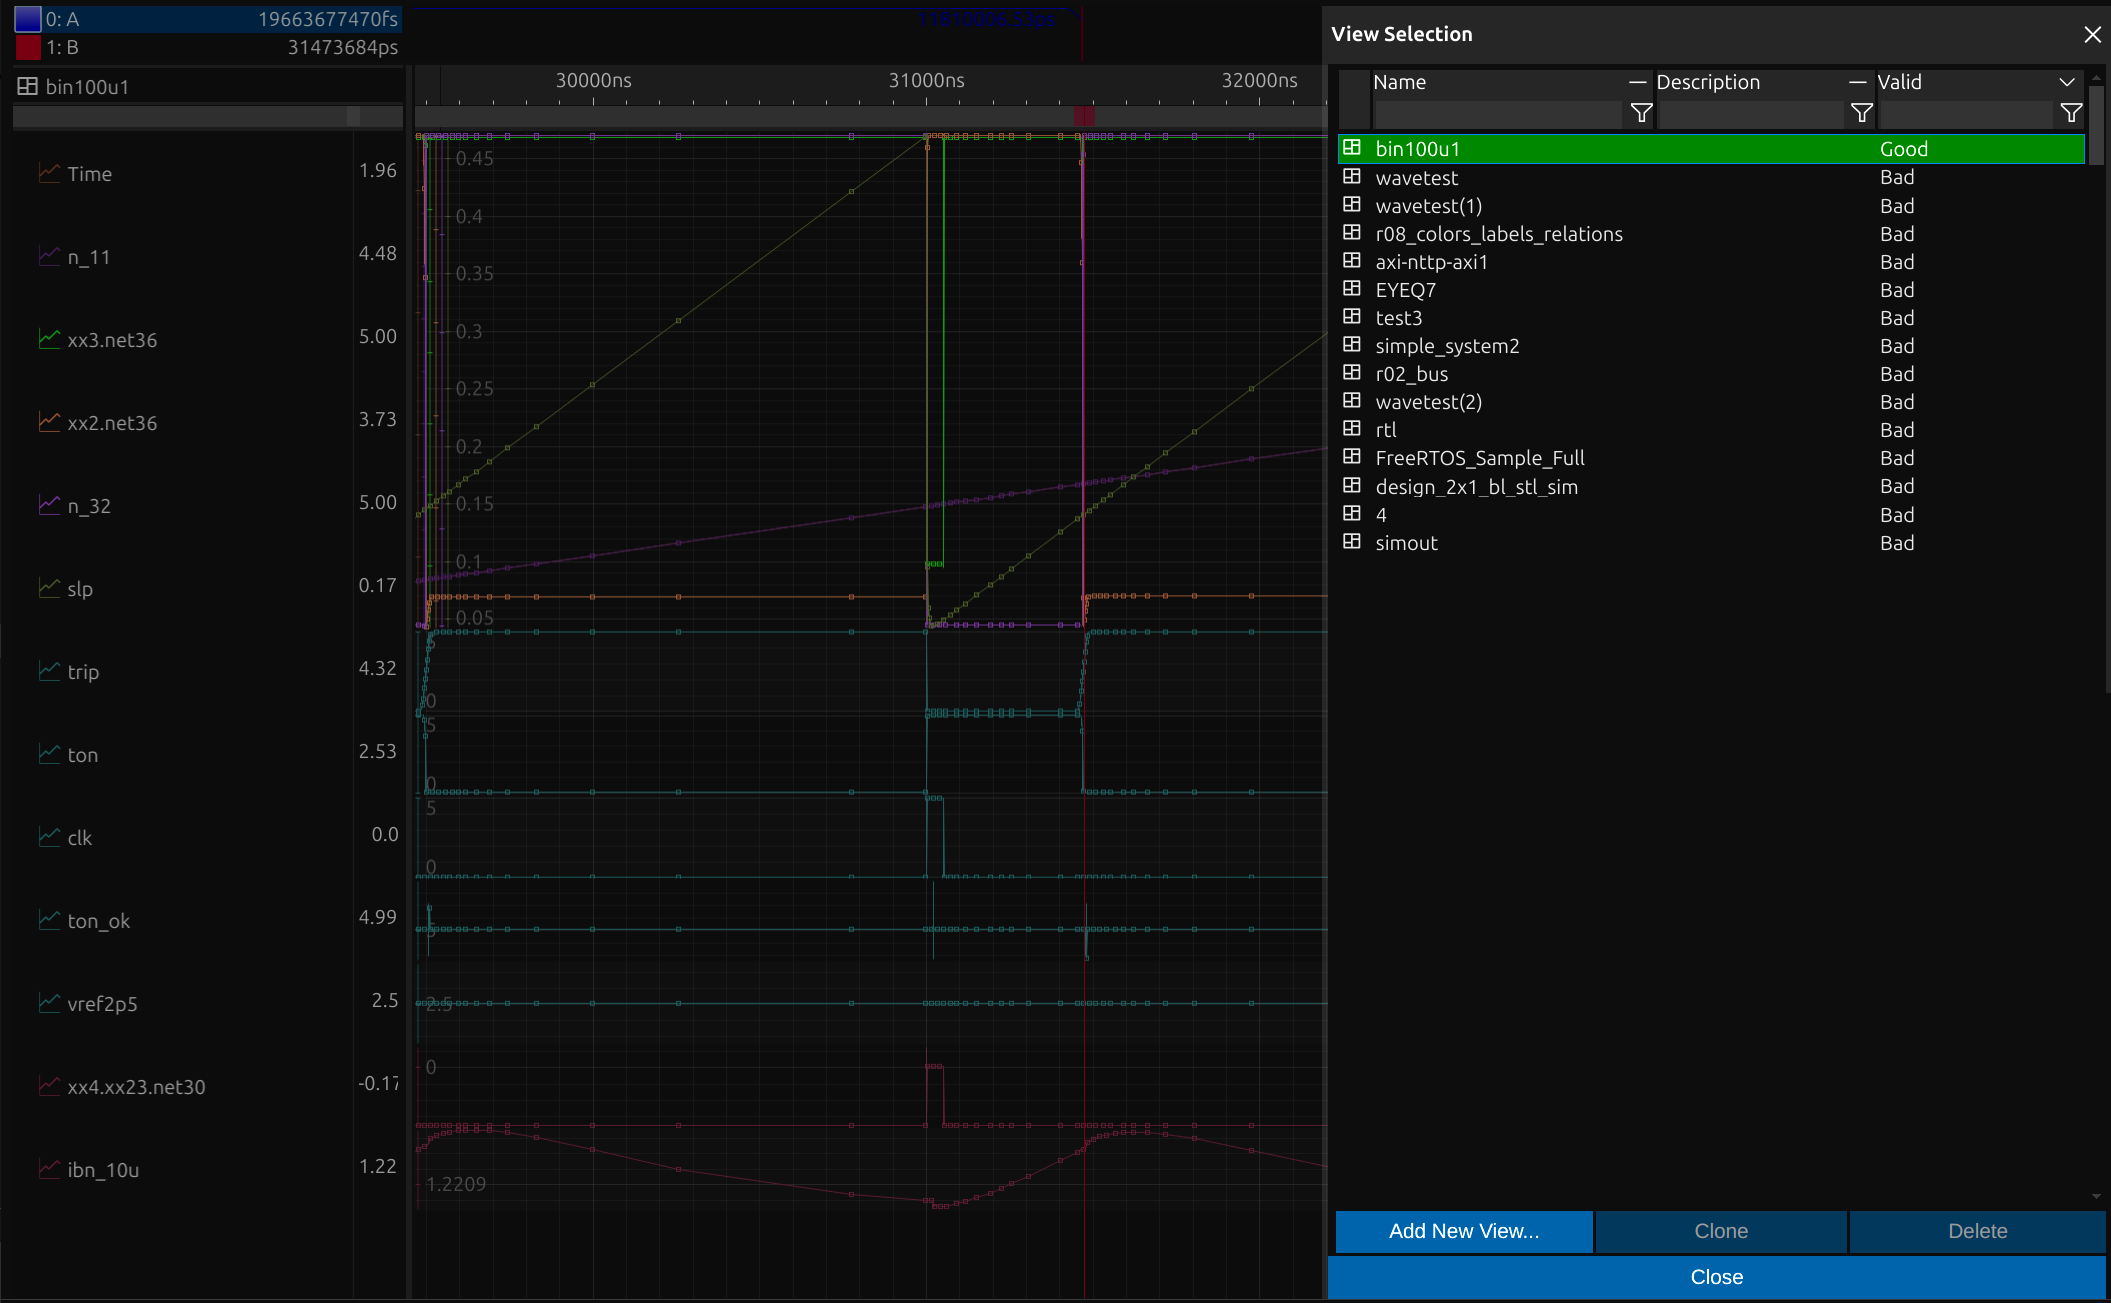
A view consists of a customizable set of diagrams, organized in a structured tree for easy navigation. Users can create multiple views tailored to their needs and switch between them seamlessly. This flexibility ensures quick access to relevant information, enhancing analysis, visualization, and overall efficiency in signal interpretation.
Diagrams
Diagrams provide customizable visual representations of signal data, offering clarity and precision in analysis. They can share a zoomable, scrollable axis, such as trace time, or be dynamically resized to fit the display. This flexibility allows users to adapt diagrams for detailed inspections, ensuring efficient signal interpretation and system debugging.
Use multple Domains, Axes and Cursors
impulse enables signal visualization across multiple domains, such as time and frequency, within a single view. Users can define multiple cursors to navigate and measure within signals, with a dedicated detail area displaying the current cursor position and delta distances. This flexibility enhances precise signal analysis and navigation.
Your point of view
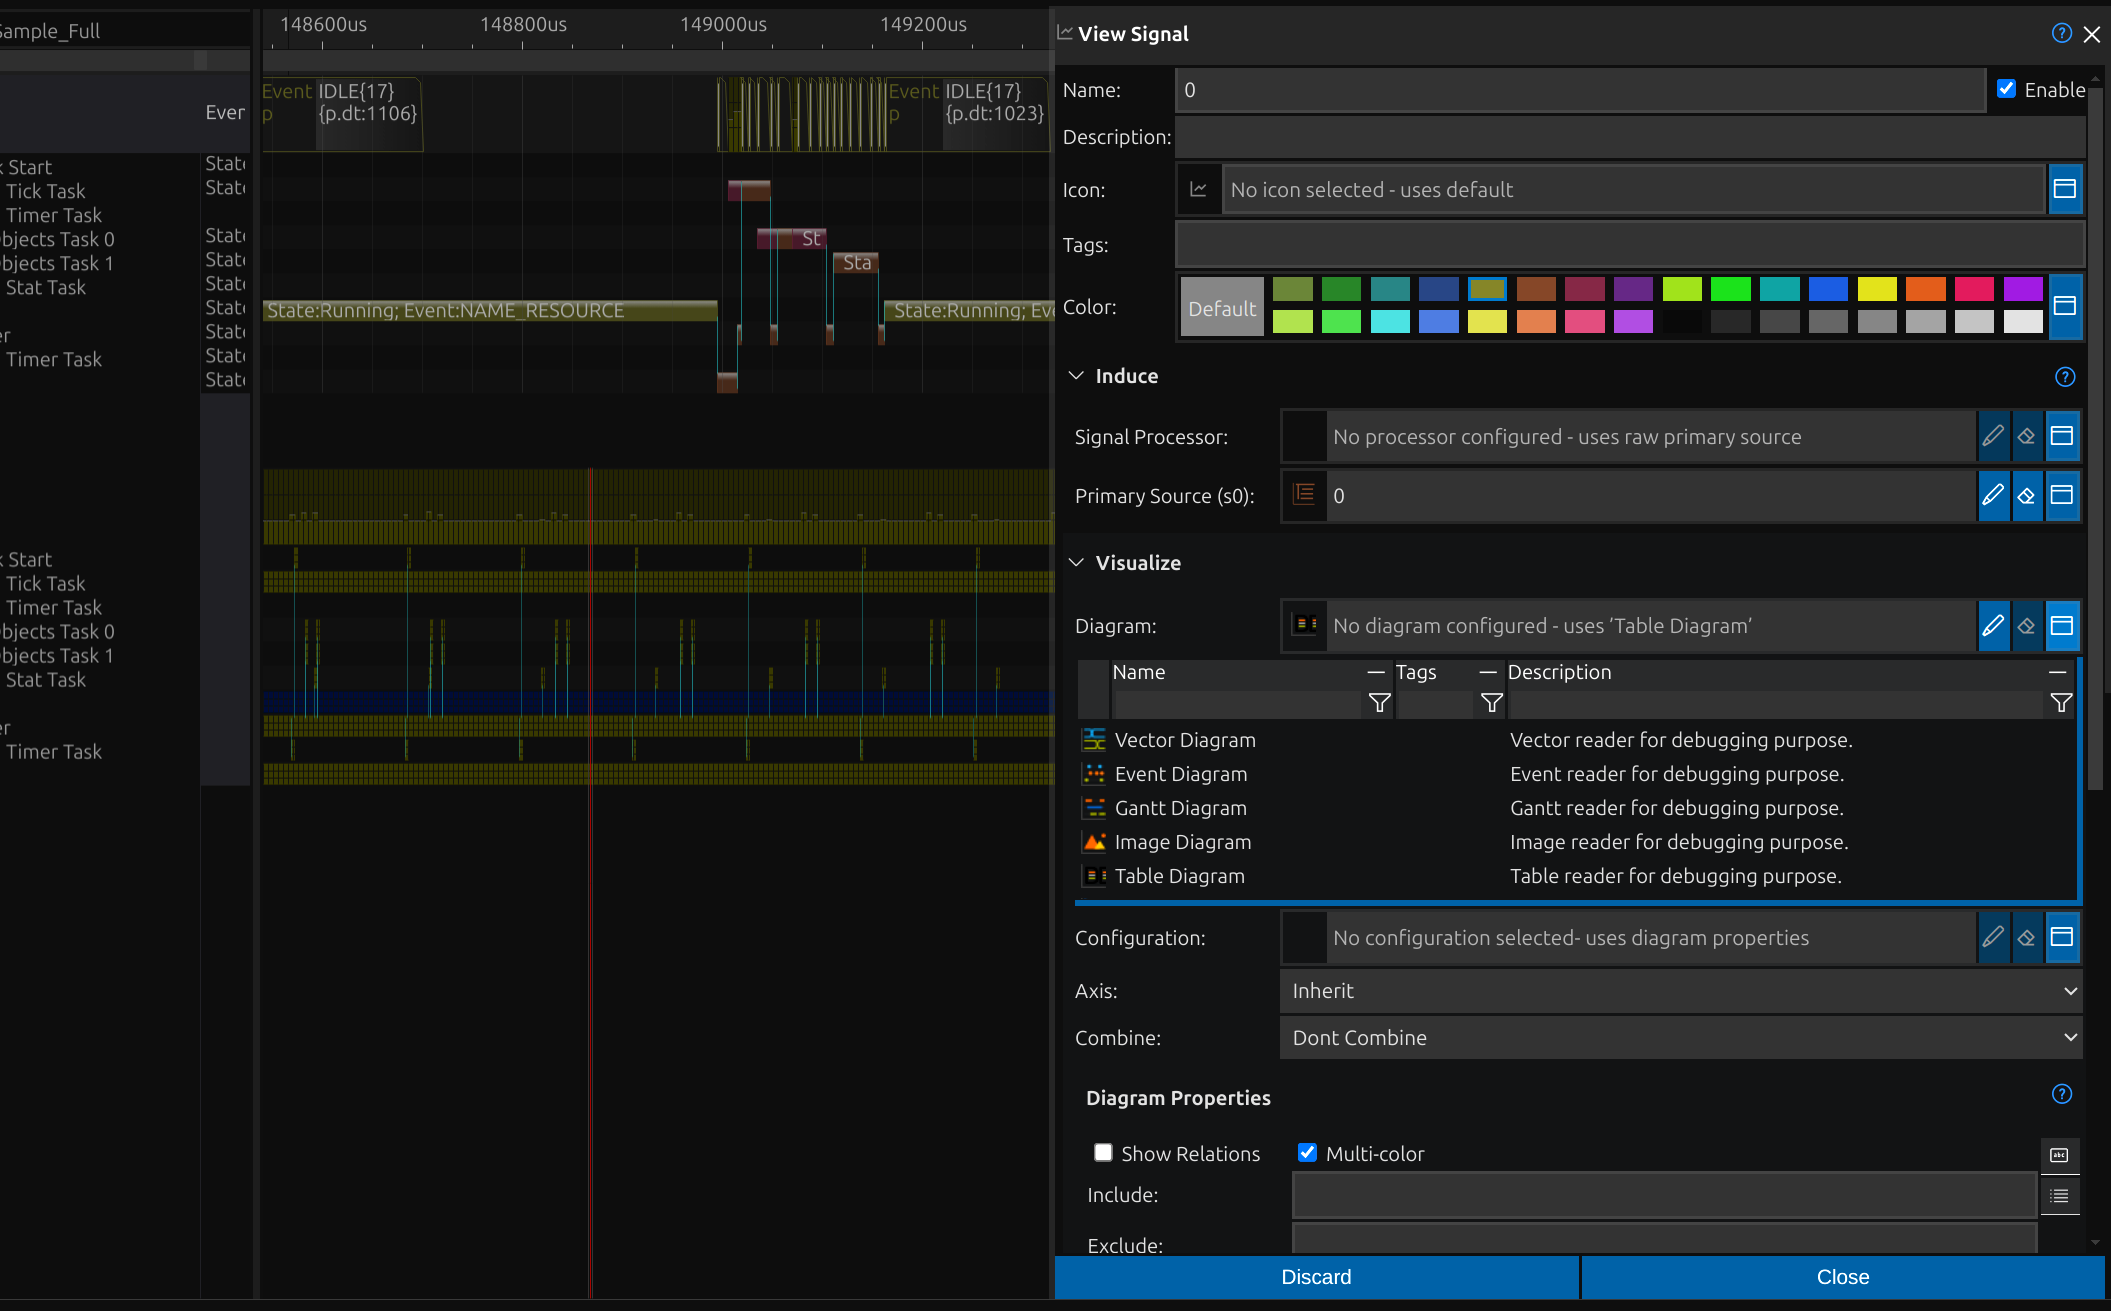
Diagrams
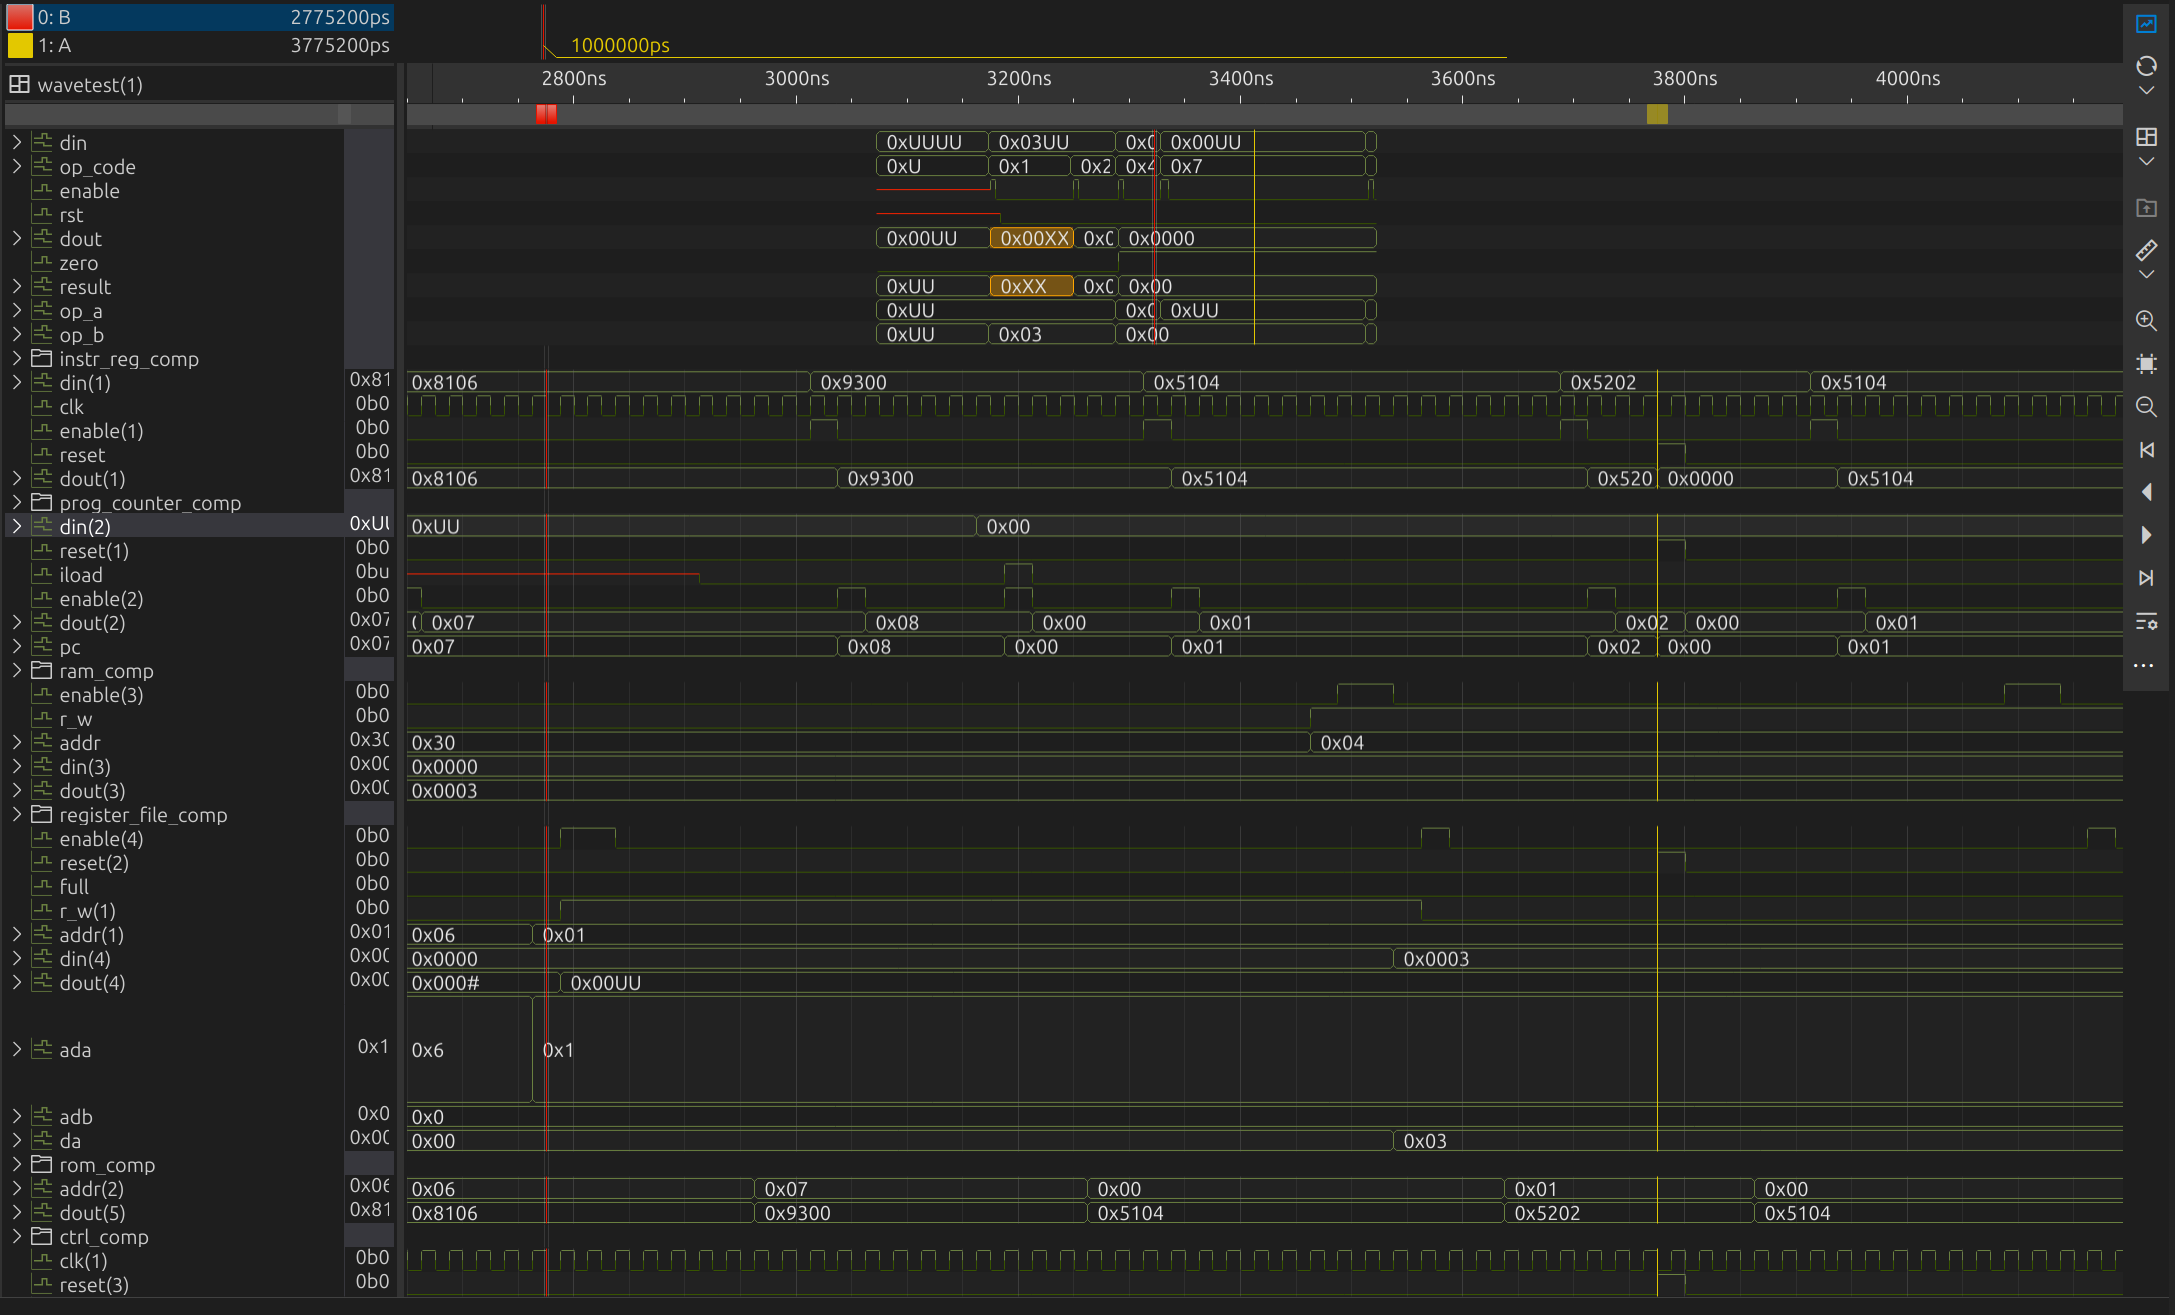
Use multple Domains, Axes and Cursors
Domains and Axes
impulse can display waveforms using multiple domains (e.g., time and frequency) in one view. If your signals are using the same domain, it allows you to display them on multiple axes.
Online Display
Incoming signal values from the data stream are continuously updated. Start analysing signals while streams are still loading.
Quick measurement
Search
Value Formats
Combine
You can combine or separate signals in diagrams with a single click.
Complementary Views
Sample Tables & Inspector
Sample Tables offer a tabular representation of signal data, fully synchronized with the active viewer, including signals, cursors, and data streams. As the viewer selection changes, the input signal updates accordingly, while the selected sample aligns with the cursor position. For streaming data, real-time updates ensure continuous refreshes. Users can apply filters to refine results and combine multiple signals along the index order for comprehensive analysis. Configurable columns and formats allow customized value representations for different data types. These features enhance signal inspection, enabling precise monitoring, efficient debugging, and deeper insights into system performance and behavior.
Synchronize Signals
The input signal is synchronized with the selection of the active viewer.
Synchronize Position
The selected sample is synchronized with the cursor position of the active viewer.
Refresh
Signal data in the case of streams (online data) are continuously refreshed.
Filter
Filters can be applied to all columns.
Combine
Multiple signals can be combined along the index order.
Configurable Columns and Formats
A value representation can be configured for all types and members.
Analyse
Explore In Depth
Signal calculation tools are essential for deeper system analysis and debugging. By automating complex tasks, they reveal hidden relationships, detect inconsistencies, and enhance system reliability. Mathematical operations enable signal combination, while protocol parsers decode data exchanges. Reference signal generation aids in comparisons, and statistical extraction provides valuable performance insights. Automated conflict detection accelerates troubleshooting, reducing manual effort. These tools allow users to explore data in depth, uncovering patterns that would be impossible to identify visually. By leveraging automation, engineers can efficiently analyze large datasets, improving decision-making, optimizing performance, and ensuring robust system functionality.

Create or derive Signals
Signal processors enable the creation of new signals from existing ones or even from scratch. They combine signals using mathematical operations, extract meaningful patterns, and implement protocol parsers to decode data. By generating reference signals and transforming raw inputs, these tools enhance analysis, debugging, and overall system performance.
Inspection of signal components or derivations
The signal tree provides an in-depth view of signal components and derived data. It enables users to inspect logic signal bits, analyze structured protocol elements, and examine real-time trace tasks and timers. This detailed breakdown enhances debugging, ensuring precise signal interpretation and deeper system understanding.
Analyse large datasets
Analyzer operations efficiently process vast datasets with multiple signals in the background. They extract statistical insights, identify patterns, and automatically detect issues. By automating analysis, these tools enhance efficiency, reduce manual workload, and provide deeper visibility into system performance, ensuring accurate diagnostics and informed decision-making.
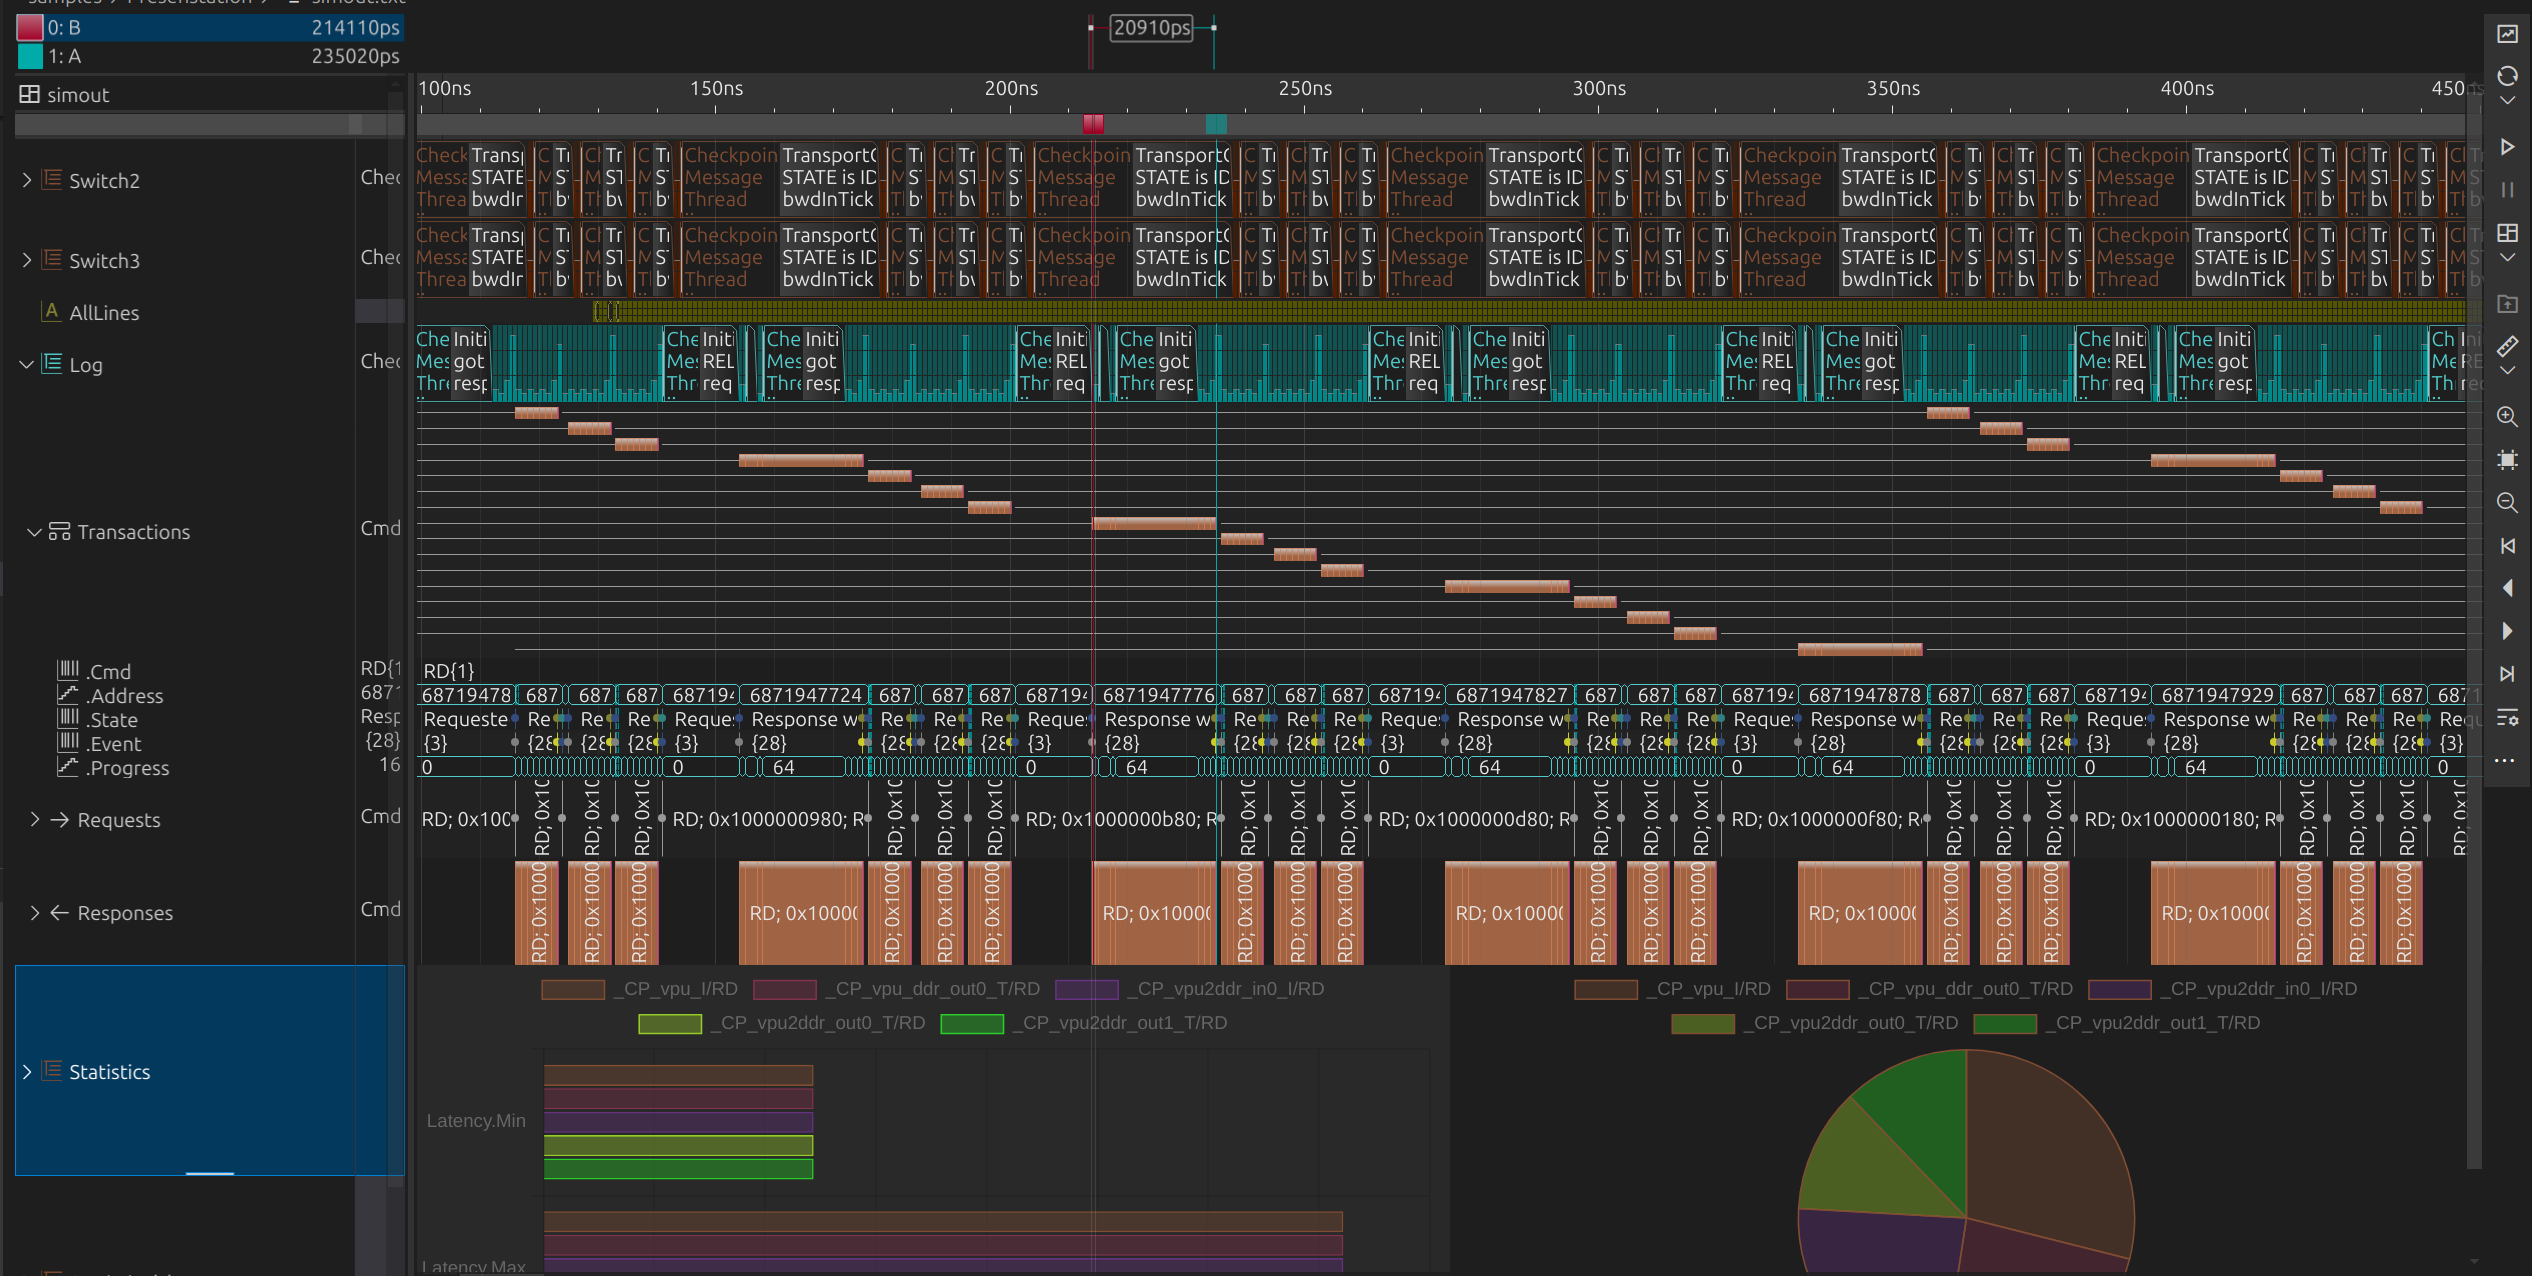
Analyzing transactions
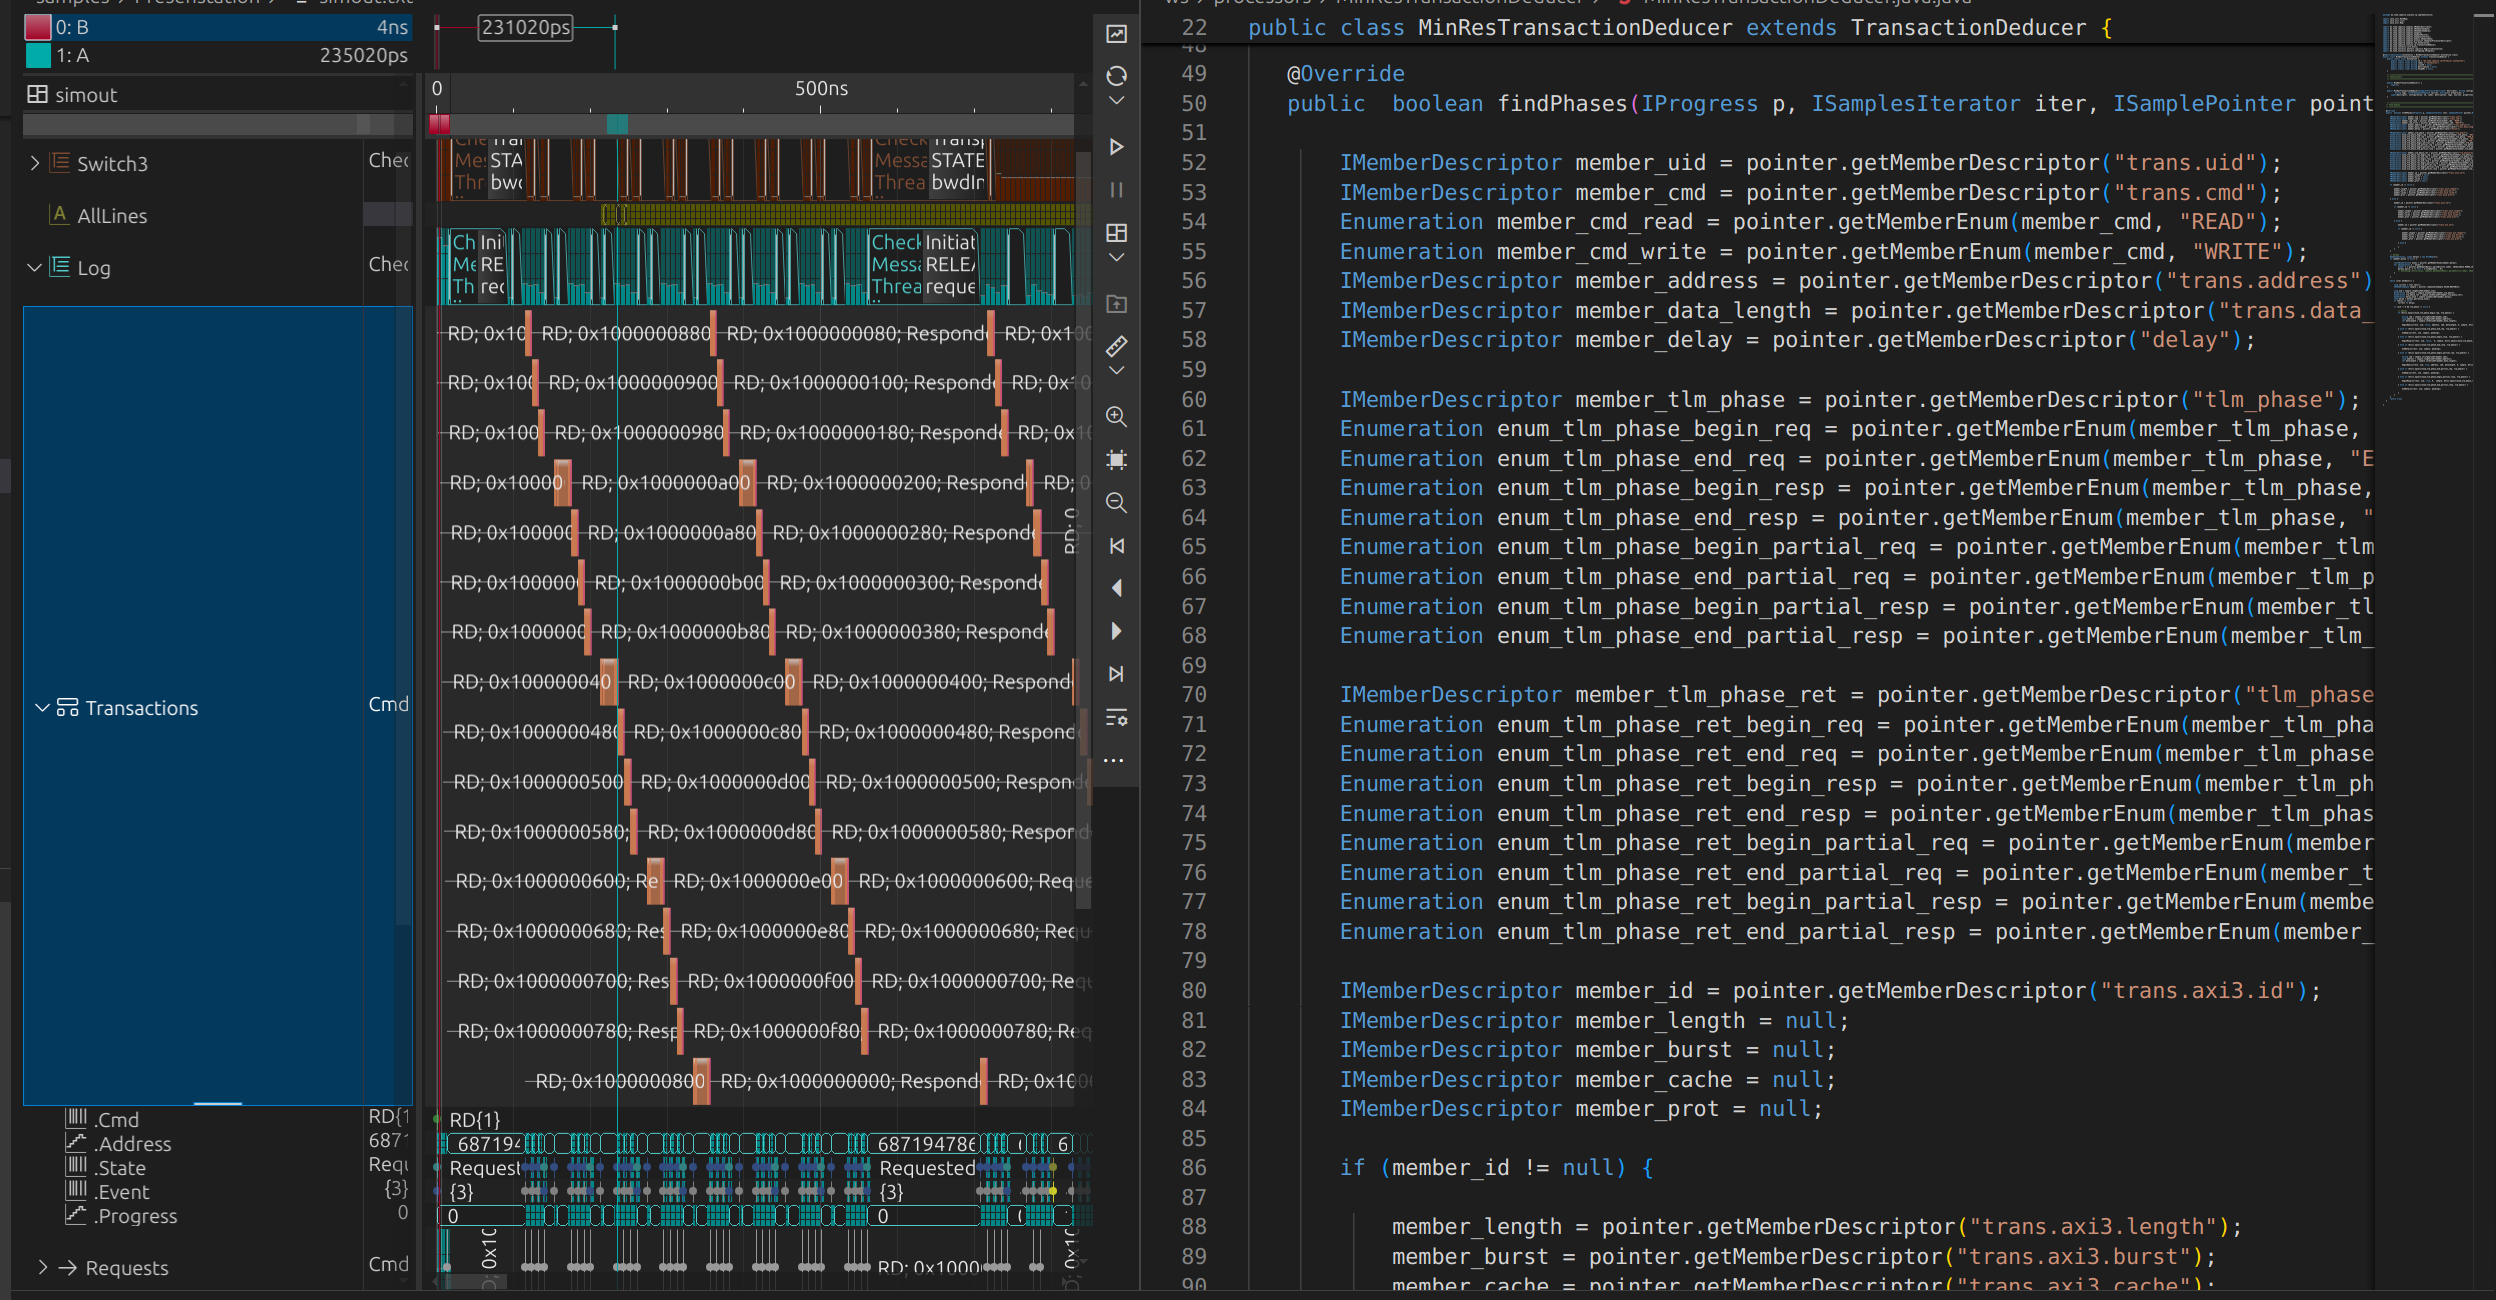
Signal processor
Signal chains
Signal processors shape new signals, either from scratch or by transforming existing ones. Each view signal may embed a processor, merging sources from other signals to form complex outputs. This layered approach creates dynamic signal chains, where each transformation builds upon the last, ensuring adaptability and continuity in the system.
Streams
Streamed signal data enables continuous processing, generating new output with each input while preserving existing samples. This ensures real-time adaptability, maintaining data integrity and allowing seamless signal evolution without altering past results.
Interactive
Modifying a processor settings or expression instantly alters the output, providing immediate feedback and enabling dynamic control over the signal and view settings.